
Bitcoin is trading roughly 46% below its all-time high of $126,080, a drawdown deep enough to fuel debate over whether a major cycle bottom is forming. History, however, suggests that past bottoms required far steeper declines, and the current pullback may not yet meet that bar.
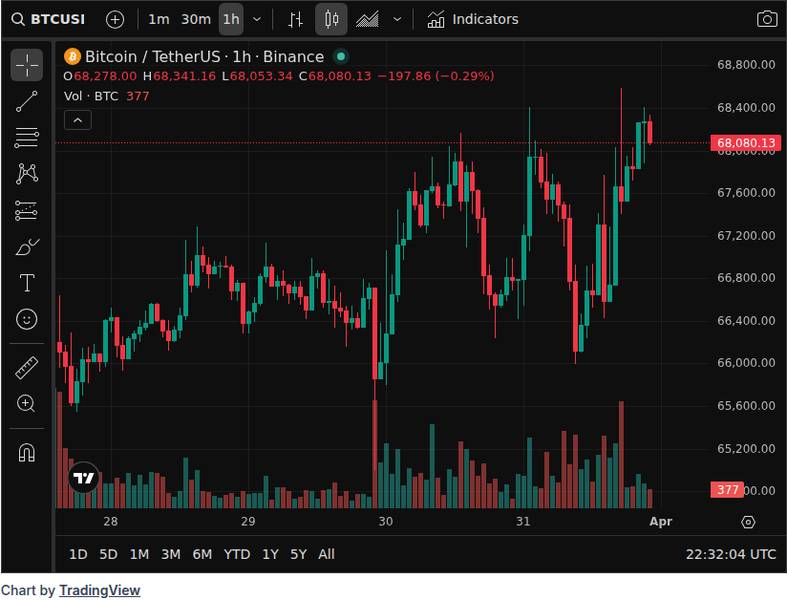
BTC last traded at $68,124, up about 2% over the prior 24 hours, with a market capitalization near $1.36 trillion. CoinGecko data places the latest all-time high at $126,080, reached on October 6, 2025, putting the current price 45.96% below that peak.
The Fear and Greed Index sits at 11, deep in Extreme Fear territory, a reading that reinforces the bearish mood surrounding the drawdown.
How Bitcoin’s 46% Drawdown Compares With Previous Market Cycles
Measuring peak-to-trough drawdowns from prior all-time highs is one of the most common frameworks for gauging where Bitcoin sits in a market cycle. A 46% decline is painful, but by historical standards it falls well short of the depths reached during prior cyclical bear markets.
NYDIG wrote on February 6, 2026 that Bitcoin’s move to $60,000 at that time represented a 52.5% drawdown lasting 122 days, making it the seventh-largest and seventh-longest drawdown in Bitcoin’s history. Even that deeper reading fell short of what NYDIG considers a full cyclical bottom.
Glassnode’s on-chain analysis from late February 2026 placed Bitcoin’s 7-day average drawdown at 47.3%, a depth the firm described as historically aligned with mid-to-late bear market phases rather than a confirmed recovery. At that point, approximately 9.2 million BTC were underwater, a condition Glassnode said typically characterizes the latter stages of bear cycles.
Prior Cycles Went Much Deeper
NYDIG noted that cyclical Bitcoin drawdowns have typically exceeded 70%, and said a roughly 70% drawdown looked reasonable based on the historical progression of prior cycles. If that pattern held, Bitcoin would need to fall considerably further from current levels before matching the depth of previous cycle lows.
The distinction matters for investors trying to separate a mid-cycle correction from a durable bottom. A 46% decline is severe in absolute terms, but it sits well above the 70%-plus drawdowns that preceded the rallies of 2012, 2015, and 2018. Recent Bitcoin ETF flow data showing mixed inflows and weekly outflows adds to the uncertain picture.
What Historically Defined a Major Bitcoin Cycle Bottom
Price alone has never been sufficient to identify a cycle low in real time. Past major bottoms formed through a combination of deep drawdowns, extended time spent at depressed levels, and broad capitulation among holders.
Glassnode’s observation that 9.2 million BTC were in loss highlights one component of that process. Large volumes of underwater supply tend to precede capitulation events, where weak holders sell at a loss and transfer coins to longer-term buyers. That dynamic has been a recurring feature of prior cycle troughs.
Depth, Duration, and Sentiment Exhaustion
The current drawdown checks some boxes but not all. The Extreme Fear reading of 11 on the Fear and Greed Index is consistent with the sentiment exhaustion seen near past bottoms. The drawdown depth, however, remains well below the 70%-plus thresholds NYDIG identified as typical for cyclical lows.
Duration is another factor. NYDIG’s February data showed the drawdown at 122 days, a significant stretch but shorter than the multi-month troughs that characterized the deepest bear markets. Investors who weathered past crypto collapses will recall that confirmed bottoms became apparent only well after the lowest price was printed.
Historical patterns do not guarantee the same outcome this cycle. Structural changes, including the presence of spot Bitcoin ETFs and broader institutional participation, could compress or extend the timeline in ways that diverge from earlier periods. The ETF market, which both NYDIG and Glassnode noted has recently tilted toward outflows, remains a key variable.
What Bitcoin Investors Should Watch Next If History Is the Guide
If the current drawdown is shallower than most prior cycle bottoms, two broad scenarios follow. Either Bitcoin declines further toward the 70%-plus zone that NYDIG’s framework points to, or this cycle breaks from historical norms and bottoms at a higher level than previous ones.
Signals that would strengthen a bottoming case include a sustained period of low volatility at depressed prices, a decline in the volume of BTC held at a loss as capitulation plays out, and a reversal in ETF flow trends from net outflows back to consistent inflows. Developments like the Core Foundation’s recent partnership moves suggest that builders continue to deploy capital even in a risk-off environment.
Signs pointing to another leg down would include renewed selling pressure from large holders, a further deterioration in the Fear and Greed Index below its current Extreme Fear reading, and continued ETF outflows that remove a key source of structural demand.
At 46% below its October 2025 high, Bitcoin’s drawdown is historically significant but not yet in the range where prior cycle bottoms formed. The gap between the current decline and the 70%-plus drawdowns of earlier bears remains the central tension for anyone trying to call a floor.
Disclaimer: This article is for informational purposes only and does not constitute financial or investment advice. Cryptocurrency and digital asset markets carry significant risk. Always do your own research before making decisions.