The Bitcoin Fear & Greed Index has crashed to 9 out of 100, marking only the third time in the index’s eight-year history that it has fallen into single digits. With BTC trading 47% below its all-time high and sentiment locked in Extreme Fear for 46 consecutive days, the crypto market is experiencing its deepest capitulation phase since the FTX collapse.
Fear & Greed Index Drops to 9 as Bitcoin Slides to $66,762
The Crypto Fear & Greed Index registered a score of 9 on March 29, 2026, placing it deep in Extreme Fear territory. The reading dropped 3 points from the prior day’s score of 12, extending a weeks-long descent that has kept the index below 25 since mid-February.
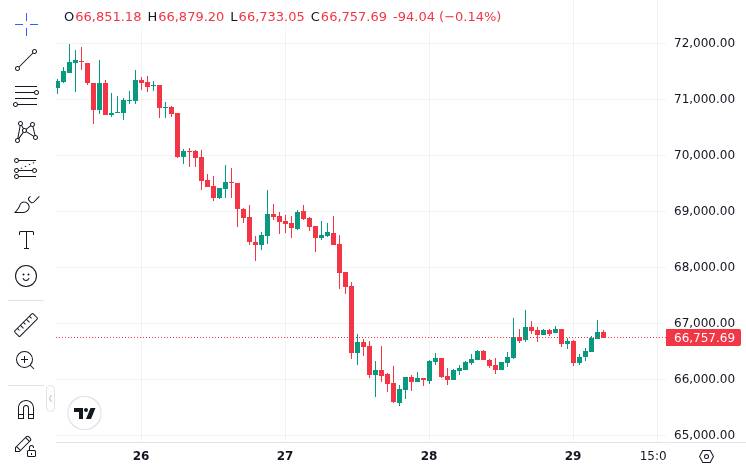
Bitcoin was trading at $66,762 at the time of the reading, down 3.67% over the past seven days. The cryptocurrency’s market cap stood at $1.34 trillion with $23.70 billion in 24-hour trading volume.
Over the past seven days, the index has ranged between 8 and 14, with every single reading classified as Extreme Fear. That unbroken streak now stretches to 46 consecutive days, the longest since the aftermath of the FTX collapse in November 2022.
BTC currently sits 47% below its all-time high of $126,080, reached on October 6, 2025. The gap between peak euphoria just five months ago and today’s capitulation-level sentiment is striking by any historical measure.
The @BitcoinFear account on X posted the index at 12 on March 28, one day before the reading slid further to 9:
Bitcoin Fear and Greed Index is 12. Extreme Fear
Current price: $66,363 pic.twitter.com/WLOY4Xd4Bm— Bitcoin Fear and Greed Index (@BitcoinFear) March 28, 2026
Source: @BitcoinFear on X
What Bitcoin Has Done After Similar Sub-10 Readings
A score of 9 is exceptionally rare. Since the Fear & Greed Index launched in 2018, readings below 10 have occurred only three times: March 2020 during the COVID liquidity crisis, June 2022 during the Terra/Luna collapse, and now March 2026.
In both prior instances, Bitcoin was near a local bottom. After the COVID crash drove the index to single digits in March 2020, BTC rallied roughly 50% within 90 days. Following the Terra/Luna implosion in June 2022, Bitcoin consolidated for several months before beginning its next bull cycle in early 2023.
The current 46-day Extreme Fear streak adds another layer. A SpotedCrypto analysis documented this as the longest unbroken stretch of Extreme Fear since FTX’s collapse shook the market in late 2022. That earlier streak also preceded a multi-month recovery.
Past patterns do not guarantee future outcomes. However, every prior sub-10 reading has coincided with a period that, in hindsight, marked a significant accumulation zone for long-term holders.
The Five Signals Driving Today’s Score
The Fear & Greed Index aggregates five components, each carrying a different weight in the final score. With the index at historic lows, at least two of those components appear to be under extreme pressure.
Volatility measures how sharply BTC price is swinging compared to 30-day and 90-day averages. With Bitcoin down 47% from its October high and posting consistent weekly losses, this component is likely the single largest drag on the score.
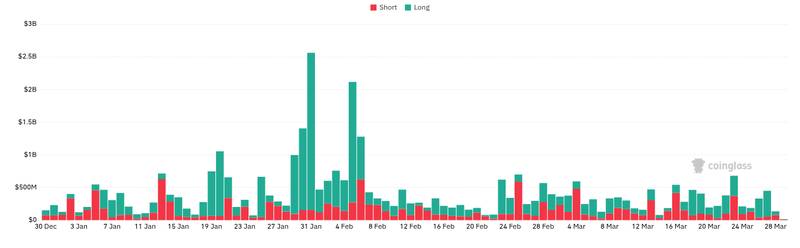
Market momentum and volume track whether buying or selling pressure dominates. The 3.67% weekly decline and the sustained multi-week slide suggest selling momentum remains firmly in control.
Social media sentiment captures the tone of crypto discussions across platforms. With 46 straight days of Extreme Fear, negative sentiment has become self-reinforcing as traders share bearish charts and capitulation narratives.
Bitcoin dominance measures BTC’s share of total crypto market capitalization, while Google Trends data tracks retail search interest in crypto-related terms. When retail interest wanes and capital rotates away from altcoins, these components can shift the reading in either direction.
The combination of elevated volatility and declining momentum appears to be the primary driver behind the index holding at single-digit levels for the first time in nearly four years. Whether these conditions mark the final stage of capitulation or the start of a deeper downturn will depend on how the macro environment and on-chain flows develop in the weeks ahead.
Disclaimer: This article is for informational purposes only and does not constitute financial or investment advice. Cryptocurrency and digital asset markets carry significant risk. Always do your own research before making decisions.