Glassnode data shows Bitcoin’s blockchain recovery remains incomplete, with 3.4 million BTC held by short-term holders sitting in unrealized loss, the largest such volume since July 2018, even as long-term holders quietly resume accumulation.
The analytics firm published its Week 12 on-chain report on March 26, 2025, describing a market caught between two opposing forces: newer investors absorbing heavy paper losses while longer-duration holders begin absorbing supply again.
Short-Term Holder Losses Show Why the Recovery Still Looks Fragile
Glassnode reported that short-term holder supply in loss surged to 3.4 million BTC, the highest reading since July 2018. That figure captures every coin held by wallets younger than 155 days that was bought at a price above the current market level.
More than 90% of short-term holder supply was underwater at the time of publication, after the percent-supply-in-loss metric moved above its +1 standard deviation band. Glassnode noted that condition had been seen only twice before during the current bull market cycle.
The stress among newer holders is playing out against a backdrop of deep risk-off sentiment. The Crypto Fear & Greed Index sat at 8, deep in “Extreme Fear” territory, even as longer-term on-chain metrics pointed toward structural recovery. That disconnect, heavy sentiment pessimism alongside early accumulation signals, frames the current phase as one where conviction is being tested rather than rewarded.
Long-Term Holder Re-Accumulation Suggests Stronger Hands Are Returning
On the other side of the ledger, Glassnode wrote that a shift toward long-term holder accumulation appears ongoing, with wealth transferring back toward price-insensitive investors. This is the recovery signal that the headline data obscures.
Across the 2023-25 cycle, long-term holders distributed more than 2 million BTC in two distinct waves. The first re-accumulation wave that followed added 817,000 BTC back into long-term holder supply, while the second wave had added 278,000 BTC at the time of Glassnode’s publication.
Across the 2023–25 cycle, Long-Term Holders have distributed over 2M $BTC in two distinct waves. Yet, each has been followed by strong re-accumulation, helping absorb the sell-side pressure. This cyclical balance may be stabilizing price action. pic.twitter.com/HAOZhG4q8o
— glassnode (@glassnode) March 31, 2025
Source: @glassnode on X
On March 31, Glassnode reiterated on X that this cyclical balance of distribution followed by re-accumulation may be stabilizing price action by absorbing sell-side pressure. The pattern suggests that while short-term participants are under water, the supply base is rotating toward holders less likely to sell into weakness.
That rotation echoes a broader pattern visible this year. Bitcoin recently logged its first green month after five months of losses, a move that aligns with the idea of longer-term capital stepping back in after extended drawdowns.
What the Mixed On-Chain Signals Mean for Bitcoin’s Next Phase
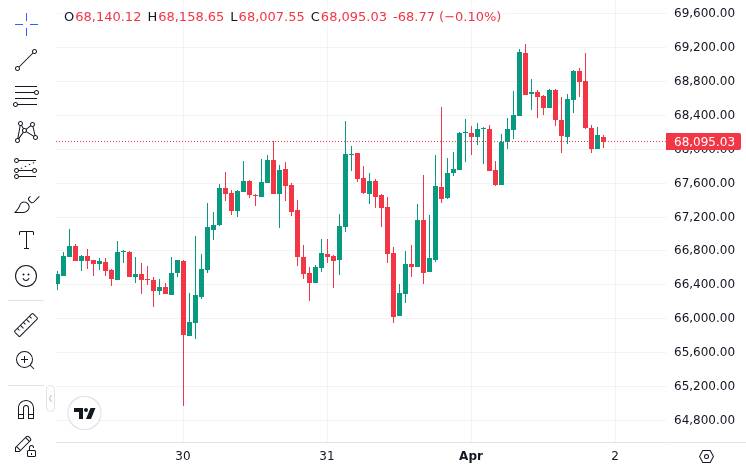
Bitcoin traded near $68,070 at the time of research, placing it well below the $78,000 to $88,000 range that Glassnode’s report identified as a key zone. FXStreet’s March 28 summary of the same report noted that declining on-chain profit-taking and loss-taking pointed to both weaker demand and reduced sell-side pressure.
That dual decline is important context. Lower sell-side pressure does not automatically translate into strong demand. It can also signal exhaustion on both sides, where neither buyers nor sellers are acting with conviction. Glassnode’s framing suggests stabilization can precede a full demand-led breakout, but the data does not yet confirm one is underway.
Meanwhile, developments on the Bitcoin protocol layer, including mempool improvements and BIP-360 progress, continue in parallel with the market’s on-chain dynamics. And activity across crypto markets remains uneven; separate on-chain tracking has shown exploiter wallets rotating funds across chains, a reminder that capital flows in this cycle are anything but predictable.
For now, Glassnode’s data paints a market where recovery is structural but incomplete. Short-term holders bear the weight of 3.4 million BTC in unrealized loss, long-term holders are absorbing supply, and the broader market waits in extreme fear for the next catalyst.
Disclaimer: This article is for informational purposes only and does not constitute financial or investment advice. Cryptocurrency and digital asset markets carry significant risk. Always do your own research before making decisions.