
Yes — Ethereum is presently displaying enough early strength to aim for the 3,300 zone and even the 3,500 zone, with improving momentum as seen on the 4H, 1D, and 1M timeframes. Confirmation of a breakout would require a close above 3,260, though a move through 3,353 opens the way towards the 3,580 zone and the wider 3,500–4,000 expansion range.
Ethereum changes hands between 3,158 and 3,175 and continues to exhibit slight upward pressure as technical indicators on various timeframes begin to improve. The market sentiment is slowly shifting from cautious to cautiously optimistic as oscillators strengthen and moving averages no longer give uniform downside signals.
The recent bounce has attracted renewed attention because it coincides with rising volume and a clear shift in MACD and RSI behavior. Buyers are becoming more active at lower levels, and the short-term trend structure is improving.

| Key Highlights: – ETH momentum improves on 4H, 1D, and 1M with RSI reclaiming midpoint and MACD turning upward. – Breakout triggers: close above 3,260, extension above 3,353 → opens path to 3,580 and 3,500–4,000. – Long-term trend flips bullish, supported by Strong Buy on the monthly chart and a developing bottoming structure. |
Ethereum Price Snapshot
| Metric | Value |
|---|---|
| ETH Price | 3,158–3,175 USD |
| Daily Change | +1.34 percent |
| Oscillators Summary | Neutral (1 sell, 8 neutral, 2 buy) |
| Moving Averages Summary | Sell (8 sell, 1 neutral, 6 buy) |
| Overall Technical Summary | Neutral (9 sell, 9 neutral, 8 buy) |
4H Chart Strong Buy Across Short Term Indicators
The strongest bullish alignment comes from the 4-hour chart. TradingView data presents 14 buy signals, 10 neutral indicators, and only 2 sell. This confirms a favorable short-term environment for continuation moves, especially if volatility remains supportive.
RSI on the 4H sits at 63.2, which is in line with healthy bullish momentum. Stochastic at 68.8 still holds upward potential without being overstretched. MACD gives a clear Buy reading with a value of 62.7 and a steadily rising histogram, which often precedes short bursts of upward price expansion.
Short-term moving averages provide strong confirmations, with 12 buy signals, 1 neutral reading, and only 2 sell. EMA 10, 20, 30, and 50 are all below the current price, creating a layered support region that strengthens trend reliability on this timeframe.
Daily Chart MACD Reversal and RSI Recovery
The daily timeframe is clearer for improvement, with a Buy rating based on 9 sell, 9 neutral, and 8 buy.. This reflects strengthening short-term momentum as buyers gain confidence after a period of sustained weakness.
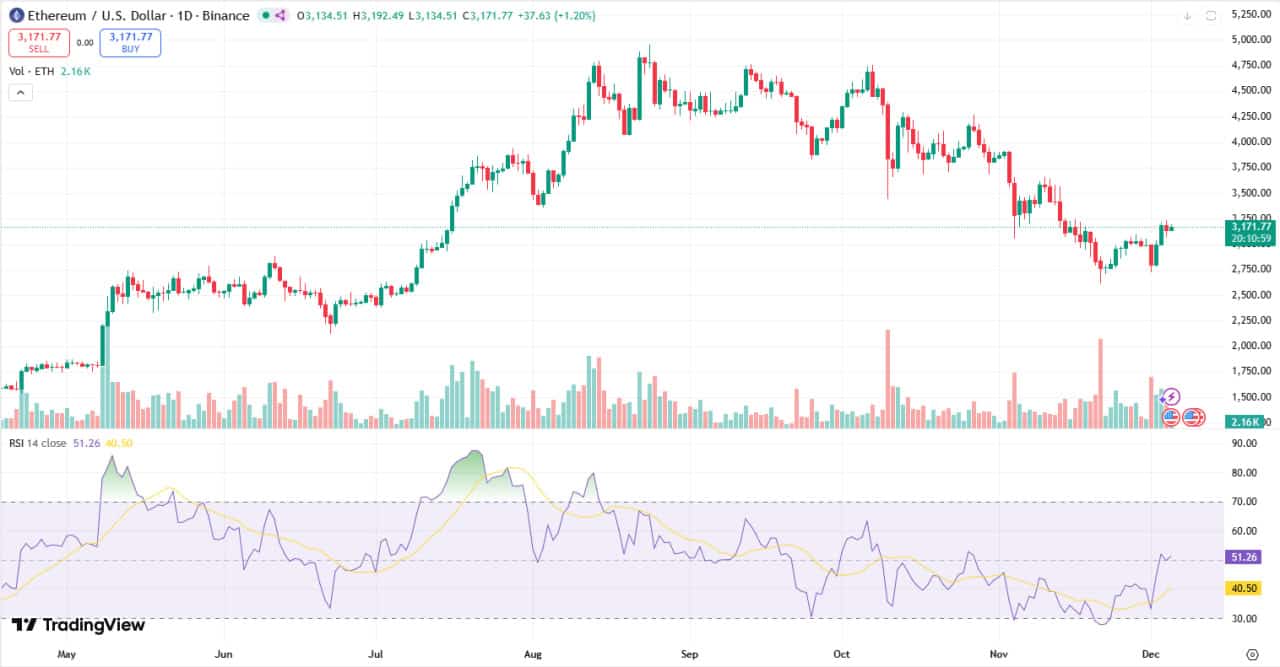
The daily RSI at 51.26 is putting ETH back above the midpoint and renewing buying interest. High Stochastic K at 88.0 continues to support upward continuation as long as price holds near intraday support levels. The MACD prints 58.42 on the MACD line and -82.11 on the signal line, with a histogram of 140.54, which reinforces bullish short-term momentum.
The daily moving averages lean towards Sell with 8 sell signals, 1 neutral, and 6 buy. EMA 10 and EMA 20 have slipped below price that provides a cushion in the short term. Overhead SMA 50, and SMA 100 will act as tests for the continuation of the trend.
Weekly Chart Neutral Structure With Emerging Strength
On the weekly timeframe, TradingView has Ethereum at a Neutral rating, with 10 indicators pointing towards sell, 6 neutral and 10 buy. This reflects a balancing act that epitomizes a transition phase where bearish pressure has dissipated but bullish conviction has not yet been able to take hold. Price stability around higher lows is serving to preserve the integrity of the medium-term structure.
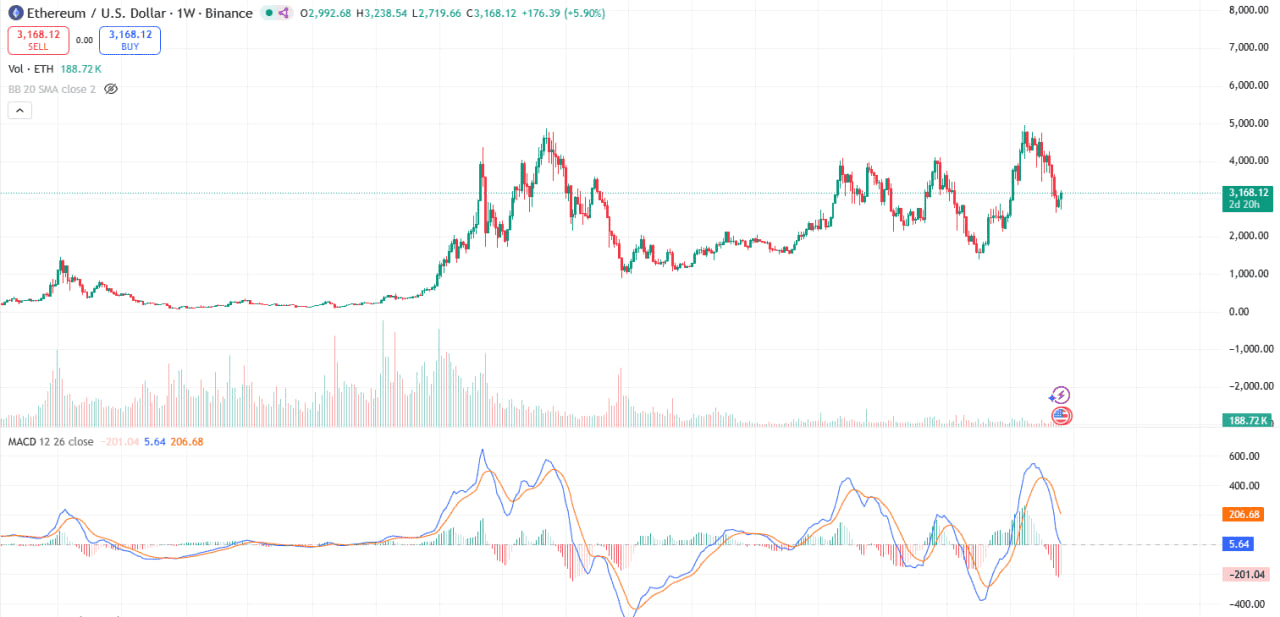
The weekly oscillators are giving a Buy signal. RSI sits at 51, confirming neutral but stabilizing momentum. Stochastic K reads 88.0 reflect early improvement in directional strength. These subtle shifts often precede more defined trend reversals if volume and improving fundamentals support them.
The weekly moving averages still point to Sell with 8 sell signals and 6 buy. EMA and SMA clusters from the 10 to 30 week range remain above current price, which suggests Ethereum needs to have a breakout above these regions to confirm a stronger medium-term uptrend.
1 Month Chart Long Term Bias Turns Positive
Among all timeframes, the monthly chart is the most constructive. In TradingView, there are 13 buy signals, 9 neutral indicators, and 2 sell. This is a very meaningful shift in long-term sentiment and supports the idea of Ethereum being in a broader bottoming structure.
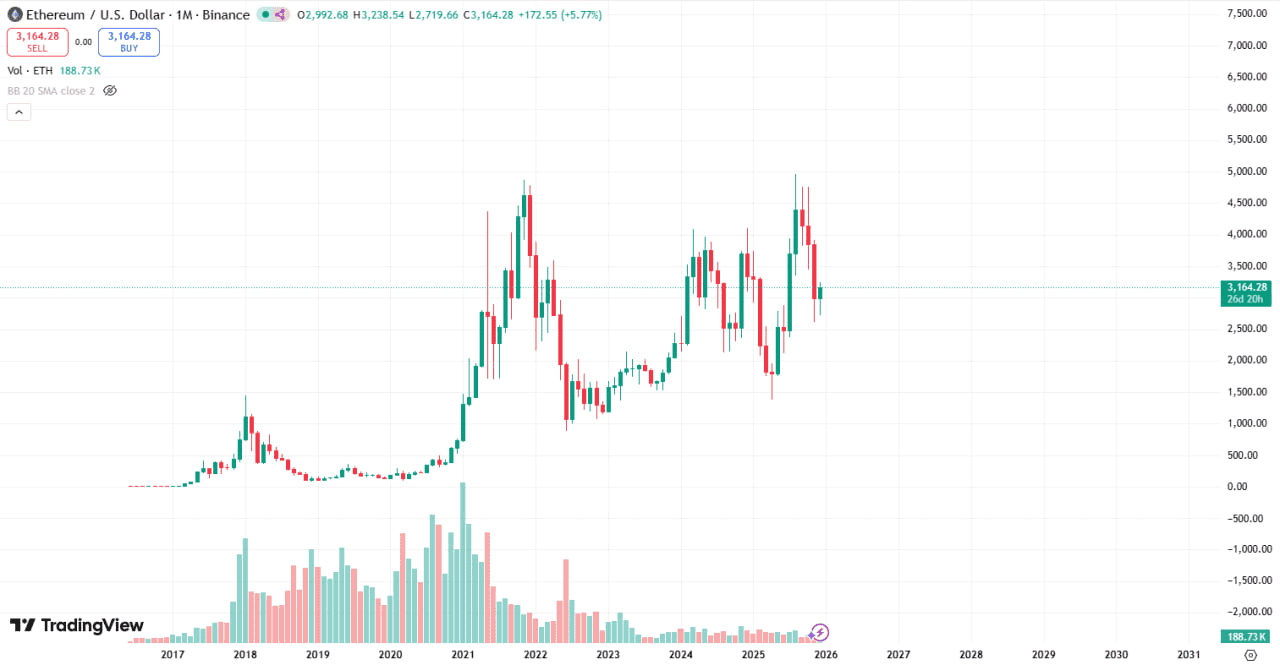
Monthly RSI-52.2 confirms that ETH is regaining long-term balance above the midpoint. MACD at 5.64 on the MACD line, -201.04 on the signal line, and 206.68 histogram has turned positive again, and it shows early momentum recovery.
Moving averages on the monthly timeframe rate as Strong Buy with 10 bullish signals and only 2 bearish, thus reinforcing the broader outlook that Ethereum remains within an intact long-term uptrend.
| Disclaimer The information provided in this article is for educational and informational purposes only and does not constitute financial, investment, or legal advice. Cryptocurrency and blockchain markets are volatile, always do your own research (DYOR) before making any financial decisions. While TokenTopNews.com strives for accuracy and reliability, we do not guarantee the completeness or timeliness of any information provided. Some articles may include AI-assisted content, but all posts are reviewed and edited by human editors to ensure accuracy, transparency, and compliance with Google’s content quality standards. The opinions expressed are those of the author and do not necessarily reflect the views of TokenTopNews.com. TokenTopNews.com is not responsible for any financial losses resulting from reliance on information found on this site. |
Tracks ETF positioning, staking access, validator economics, and how Ethereum market structure evolves around institutional flows.
Tracks AI-agent tokens, compute and data infrastructure, and where crypto markets are pricing AI-linked narratives.