
Bitcoin ETF flows on April 1, 2026 delivered mixed signals depending on the source, with blockchain analytics account Lookonchain reporting a one-day net inflow of 1,752 BTC worth $120.6 million while Farside Investors logged a net outflow of $8.6 million for the same session. The seven-day trend, meanwhile, remained firmly negative at -2,984 BTC, reinforcing caution despite the positive daily print.
Bitcoin ETF Flows Today: What the 1,752 BTC Daily Inflow Shows
A Lookonchain post published on April 1 stated that Bitcoin ETFs recorded a one-day net flow of +1,752 BTC, valued at +$120.6 million. The figures suggest a short-term rebound in institutional appetite after several days of net selling pressure.
However, the Lookonchain numbers have not been independently confirmed by the primary flow tracker. The Farside Investors Bitcoin ETF flow table recorded a total net flow of -$8.6M for April 1, a directional conflict with the Lookonchain reading. No publicly available methodology explains how Lookonchain converted the day's data into BTC-denominated units.
What the Daily Number Can and Cannot Tell Us
Even taking the more optimistic reading at face value, a single positive session does not confirm a trend reversal. The prior session on March 31 showed +$117.5M in total Bitcoin ETF net inflows on the Farside table, meaning the April 1 swing to negative territory marked a quick sentiment shift. On-chain indicators have also been sending mixed recovery signals, with Glassnode data showing 3.4 million BTC sitting in unrealized loss positions.
Without clarity on which specific ETF issuers drove the reported inflow, readers should treat the daily figure as preliminary rather than definitive.
Why the 7-Day Bitcoin ETF Trend Still Looks Weaker
The more telling figure from the Lookonchain post is the seven-day net flow: -2,984 BTC, valued at roughly -$205.45 million. According to that reading, the weekly trend remained firmly negative even as the daily print turned positive.
That contrast matters. A positive one-day inflow of +$120.6 million, according to unconfirmed Lookonchain data, would offset only a fraction of the reported $205.45 million weekly outflow. The weekly picture suggests sustained redemption pressure across multiple sessions.
Spot Price Holds Steady Despite Weekly Outflows
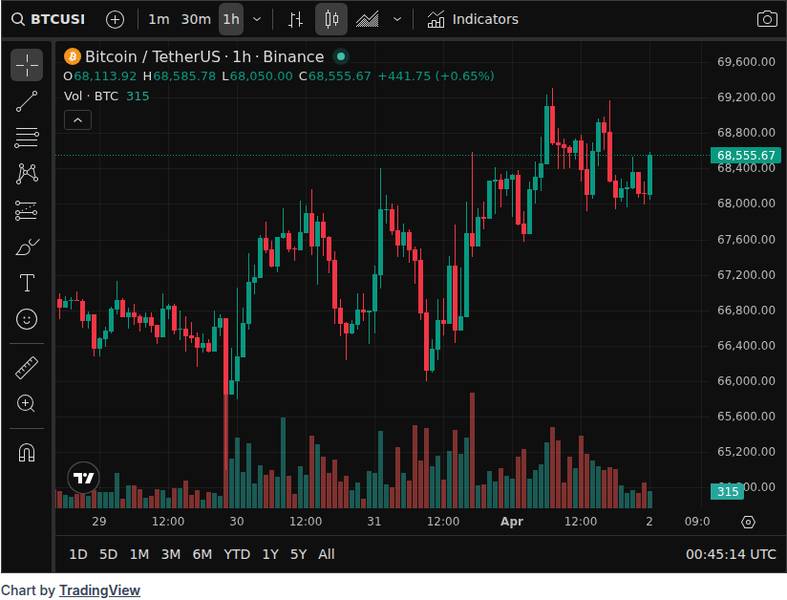
Bitcoin traded at $68,326 at press time, up 0.54% over 24 hours. The total market cap sat near $1.37 trillion with roughly $46.88 billion in daily volume, suggesting the weekly ETF outflow trend has not yet triggered a broader spot market selloff.
The Crypto Fear & Greed Index read 12, classified as Extreme Fear. That degree of bearish sentiment aligns with the negative weekly flow trajectory. Wider market anxiety has been compounded by events like the recent $270 million Drift Protocol exploit, which added to the risk-off mood across crypto.
For comparison, Decrypt reported that spot Bitcoin ETFs shed $227.9 million on March 5, 2026, the largest single-day exit since February 12, citing Farside data. That earlier episode demonstrated how quickly large outflow days can rattle sentiment.
How to Read Mixed ETF Flow Signals Without Overstating the Trend
Single-day flow data captures immediate institutional positioning. Multi-day aggregates reveal whether that positioning reflects a sustained shift or a temporary blip. When the two timeframes point in opposite directions, neither should be read as the definitive signal.
What Confirmation Would Look Like
A genuine turnaround in the weekly trend would require multiple consecutive days of net inflows large enough to offset cumulative redemptions. A positive daily print followed by another negative session would simply reinforce the existing weekly weakness.
The broader crypto ETF picture beyond Bitcoin remains unclear, as the original Lookonchain post appeared truncated, cutting off after partial Ethereum data. Readers should avoid drawing conclusions about total crypto ETF flows from incomplete information. The ongoing movement of exploited funds through DeFi protocols is also worth monitoring as a separate source of market volatility.
Until the discrepancy between Farside's -$8.6 million and Lookonchain's +$120.6 million for April 1 is resolved, the most responsible takeaway is that daily Bitcoin ETF flow data should be cross-referenced across multiple primary sources before acting on it.
Disclaimer: This article is for informational purposes only and does not constitute financial or investment advice. Cryptocurrency and digital asset markets carry significant risk. Always do your own research before making decisions.