Solana tries to hold on to the $127 region, where liquidity continues strongly in both spot and derivatives markets. Buyers and sellers persist in high-volume activity even within price compression. This is indicative of a balanced, yet fragile, environment in which any small changes in flows can shift direction.
Derivatives data shows leverage increasing with open interest across major futures platforms. This structure increases volatility risk and makes Solana more vulnerable to liquidation chains. Traders should monitor the way leverage evolves because it could accelerate market moves.
Real-time indicators like Long Short ratio, Netflows, and Funding rate give the clearest signals about momentum. These indicators show whether buyers are regaining their strength or losing control. Understanding them is crucial to assessing the probability of a reversal or further consolidation.
| Key Highlights: – Solana changes hands at about $127.4 with strong spot and futures volumes that indicate active market participation. Liquidity remains centered around major exchanges, supporting short-term price stability. – Open interest close to $6.63B suggests a highly leveraged environment in which even small price swings may create big liquidation waves. Market sensitivity stays high with the expanding futures activity. – Tracking Long Short ratio, Netflows, and Funding rate is important to understand if Solana will stabilize or break into a higher volatility phase. These indicators reveal the real balance of market pressure. |
Technical and Market Structure Overview
| Metric | Value |
|---|---|
| Price (Spot) | 127.40 USD |
| Market Cap | 71.48B USD |
| Circulating Supply | 559.65M SOL |
| Total Supply | 615.20M SOL |
| 24h Spot Volume | 1.23B USD |
| 24h Futures Volume | 14.19B USD |
| Open Interest (Futures) | 6.63B USD |
| CoinGlass data shows strong participation in both spot and derivatives markets. Although price remains compressed, liquidity and leverage remain elevated. These conditions often precede a decisive increase in volatility. |
Derivatives Liquidity and Open Interest Dynamics
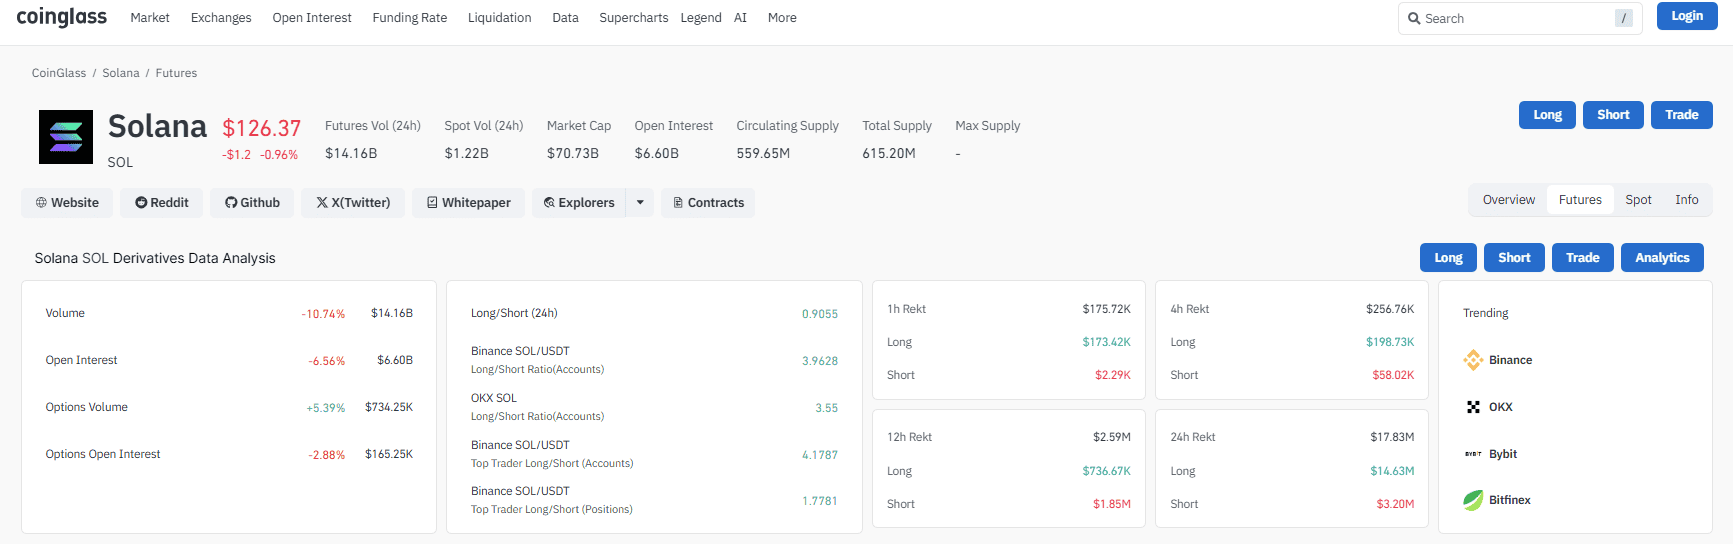
The volume of futures in the last 24 hours reached $14.19B, reflecting heavy participation. Open interest is near $6.63B, indicating large leverage across platforms. A market with high open interest usually reacts sharply to even small changes in prices.
Spot Liquidity and Circulation Health
Spot volume near $1.23B confirms strong real demand. Active spot participation supports the price when derivatives markets are under stress. High spot liquidity often prevents deep intraday drops.

The circulating supply is 559.65M SOL, while the total supply is 615.20M SOL. The narrow gap means low dilution risk and stable distribution of tokens. Markets with steady supplies often make for firmer price bases.
Spot activity and stable tokenomics together help in keeping Solana in balance during consolidation. These conditions enhance the probability of a swift recovery once the sentiment turns positive.
On-chain and spot flow signals from CoinGlass
In the Spot Netflow charts, several sessions of negative flow point toward persistent selling pressure. Red bars at key levels mark capital leaving the exchanges, with only green inflows appearing occasionally to stabilize the price.
Clusters of negative Netflow typically match price declines and confirm that spot outflows drive trend direction. Solana frequently bounces back when the Netflow turns positive. These changing flows essentially signal that no dominance has developed between the buyers and sellers.
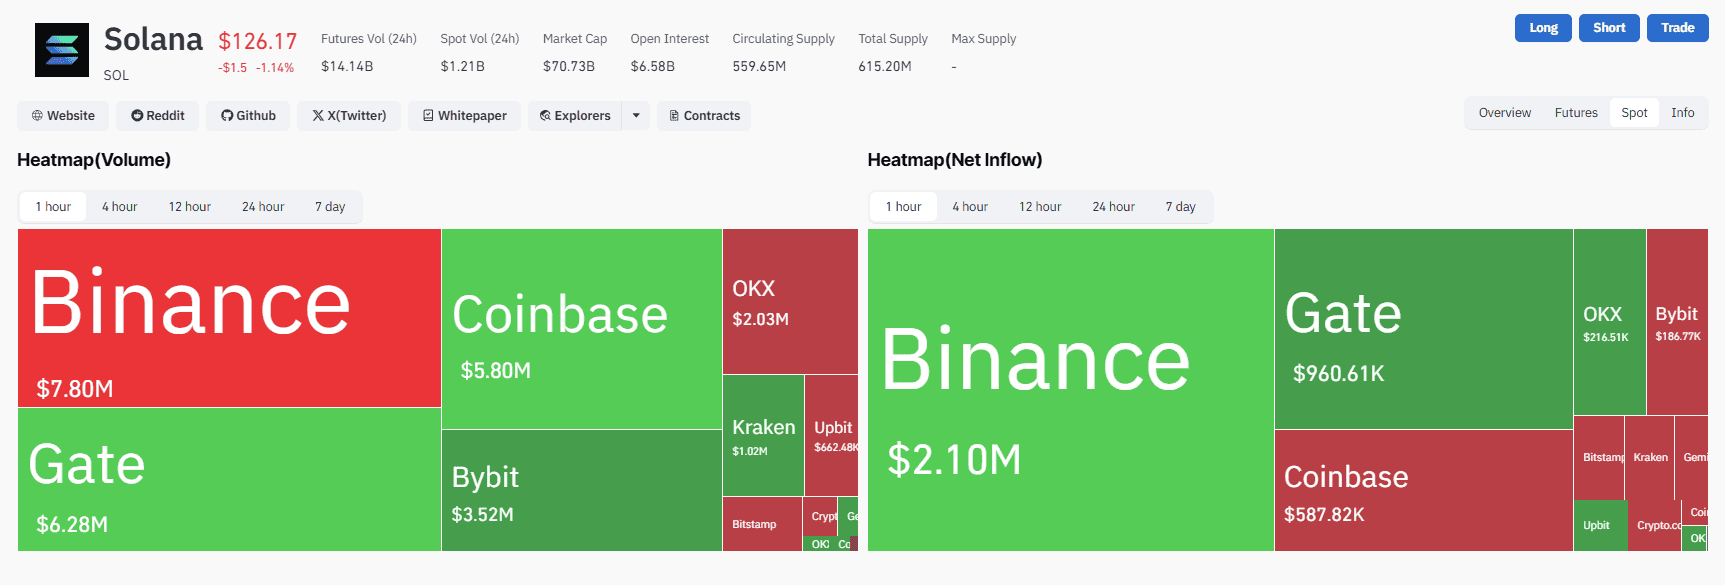
Volume Heatmap shows Binance at 7.80M USD, Gate at 6.28M USD, and Coinbase at 5.80M USD, reflecting strong liquidity across major exchanges. The Net Inflow Heatmap highlights Binance with 2.10M USD, Gate with 960.61K USD, and Coinbase with 587.82K USD, showing confident accumulation.
Market capitalization keeps pace with price action, representing real participation, rather than thin-book volatility. Stability of cap during pullbacks would attest to true demand and raise the chances of a reversal. This stable capitalization reflects that the market interest in Solana has been sustained rather than speculative.
Additional Perspective of Market Risks and Supportive Factors
Solana is situated at the point where leverage-driven risk meets spot-driven stability, and for traders, it is paramount to understand how these forces are interacting because short-term positioning can heavily depend on their balance; even small shifts in liquidity or sentiment can influence direction immediately.
High open interest further raises the chances of liquidation chains forming during sudden dips. When the price compresses in a tight range, forced selling can quickly accelerate. This sets the environment for Solana to be more sensitive to surprise volatility events across the wider market.
Larger market swings are usually indicative of a push into Solana’s derivatives markets and a squeeze on leveraged positions. When these positions unwind, the market tends to move toward local support levels. Reducing excessive leverage becomes essential in periods of stress.
Spot liquidity is usually the stabilizing factor when the derivatives pressure starts to intensify. In general, strong inflows help to absorb downside shocks, while stable tokenomics reduce dilution risk. When demand improves, spot volume spikes often lead to short-term reversals that reveal early directional signals.
| Disclaimer The information provided in this article is for educational and informational purposes only and does not constitute financial, investment, or legal advice. Cryptocurrency and blockchain markets are volatile, always do your own research (DYOR) before making any financial decisions. While TokenTopNews.com strives for accuracy and reliability, we do not guarantee the completeness or timeliness of any information provided. Some articles may include AI-assisted content, but all posts are reviewed and edited by human editors to ensure accuracy, transparency, and compliance with Google’s content quality standards. The opinions expressed are those of the author and do not necessarily reflect the views of TokenTopNews.com. TokenTopNews.com is not responsible for any financial losses resulting from reliance on information found on this site. |
Tracks tokenized stocks, real-world asset rails, issuer expansion, and the market structure behind on-chain financial products.
Tracks AI-agent tokens, compute and data infrastructure, and where crypto markets are pricing AI-linked narratives.