
Bitcoin is holding near $74,000 as the market approaches a critical overhead ceiling at $78,100, with on-chain data showing the rally still lacks the momentum needed for a clean breakout.
Glassnode's Week 15 on-chain report noted that BTC expanded to roughly $74,000, sitting approximately 5.2% below the True Market Mean at $78,100. That metric, which aggregates the average cost basis of active market participants, has acted as a dividing line between bear-market rallies and sustained recoveries in previous cycles.
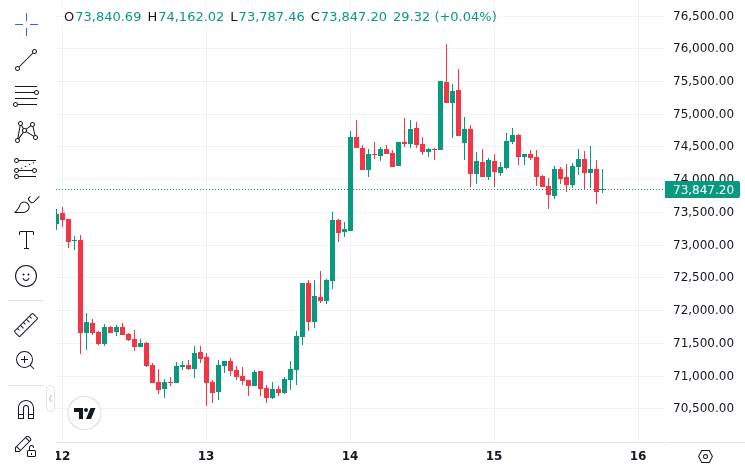
At press time, BTC traded at $73,930 with a market capitalization of roughly $1.48 trillion and 24-hour trading volume near $41.8 billion. The token had slipped 1.66% over the prior 24 hours.
The Fear and Greed Index registered 23, firmly in the Extreme Fear zone, despite BTC holding in the mid-$70,000 range. That disconnect between price stability and sentiment suggests traders remain skeptical of the rally's durability.
Why Bitcoin's $78K Level Matters This Week
The 5.2% gap between the current price and the $78,100 True Market Mean is narrow enough to invite a test but wide enough to leave room for rejection. When BTC traded below this level in prior bear-market rallies, repeated approaches without a decisive break typically preceded another leg down.
For traders watching Bitcoin ETF flow dynamics, the resistance level carries extra weight. Glassnode noted that ETF inflows and CME exposure were rebounding, but participation remained below prior highs. That pattern points to selective positioning rather than broad risk-on behavior, according to the report.
Derivatives data from Bitcoin.com News corroborated the cautious read, describing heavy put positioning and rising CME open interest around the $73,000 zone. Max pain near $70,000 added further context to the defensive posture across options markets.
What On-Chain Signals Suggest About BTC Momentum
Glassnode reported that Short-Term Holder Supply in Profit stood at 43.2%, well below the roughly 54.2% historical mean that has marked local-top exhaustion during previous bear-market bounces. In practical terms, the rally has not yet put enough short-term holders back in profit to trigger the wave of selling that typically caps these moves.
The 30-day EMA of Bitcoin's Realized Profit/Loss Ratio sat at 1.16, meaning profit realization was outpacing loss realization as prices climbed. That reading suggests holders are gradually locking in gains into strength rather than panic selling, a pattern consistent with cautious distribution rather than capitulation.
According to Glassnode's venue-level analysis, Binance-led buying was outpacing Coinbase and exchange flows had turned modestly positive. However, these exchange-flow claims were not independently verified from a second data source, so they should be treated as a single-source observation.
The broader picture from evolving derivatives infrastructure suggests institutional participation is expanding but remains selective. Institutions appear to be testing the waters rather than committing full allocations.
Most Likely Bitcoin Scenarios If $78K Holds or Breaks
If BTC breaks and sustains above $78,100, the True Market Mean would flip from resistance to support. In prior cycles, that transition has preceded multi-week continuation rallies as short-term holders move decisively into profit and selling pressure shifts from distribution to accumulation.
A rejection at or near $78,100 would keep the 43.2% short-term holder profit metric compressed. With the Realized Profit/Loss Ratio already at 1.16, a failed breakout could accelerate profit-taking and push BTC back toward the $70,000 max pain level flagged in options data.
The neutral scenario, where BTC consolidates between $73,000 and $78,000 without resolving in either direction, is also plausible. ETF flows remaining below prior highs and derivatives positioning staying defensive would both support a range-bound outcome.
Traders should monitor three signals next week: whether the Short-Term Holder Supply in Profit approaches the 54.2% exhaustion threshold, whether ETF inflows accelerate to match previous rally peaks, and whether the broader institutional infrastructure build-out translates into measurable on-chain demand. The $78,100 ceiling remains the single most important level on the chart.
Disclaimer: This article is for informational purposes only and does not constitute financial or investment advice. Cryptocurrency and digital asset markets carry significant risk. Always do your own research before making decisions.