
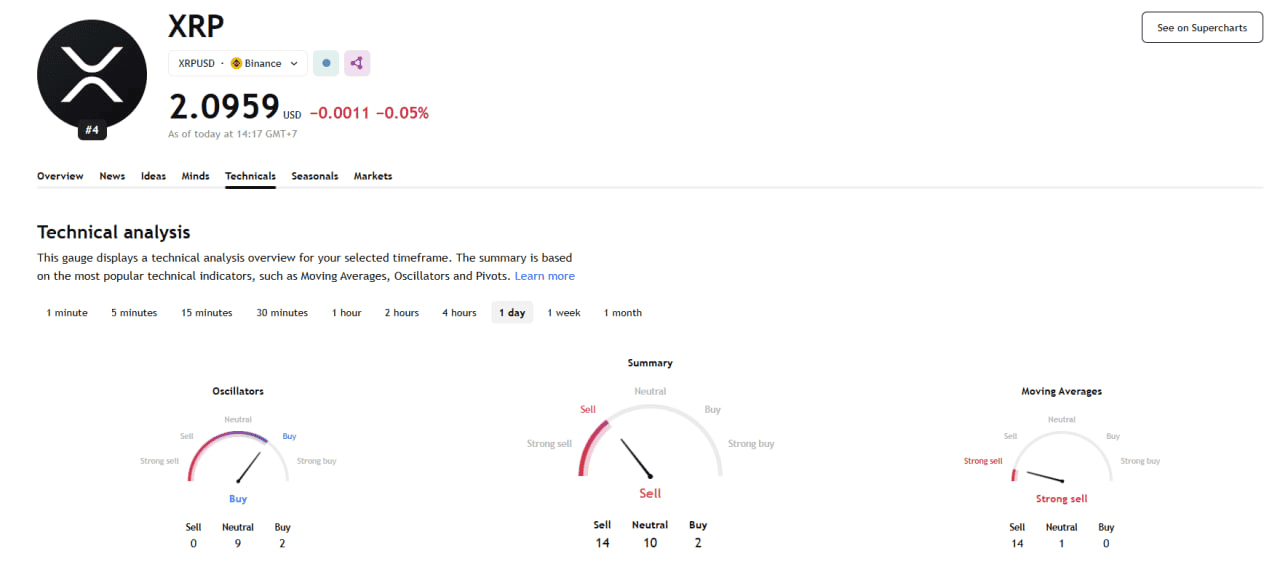
XRP currently trades in a neutral to bearish structure as momentum weakens across multiple timeframes near the 2.09 region. Sentiment in markets is in a cautious phase now, as buyers struggle to retake lost structural levels. Unless the momentum starts to improve, XRP can continue to trade sideways with a bearish tilt.
All major indicators show softer trend behavior despite attempts at stabilization. The RSI values have been reset in several timeframes, whereas MACD momentum continues to fade. These are early warning signs that buyers need stronger follow-through to avoid deeper retracement.
Overall, XRP trades within a neutral-to-bearish zone, and the 2.00 level remains the decisive structural support. With volatility tightening, market reaction around this level will determine whether price stabilizes or continues correcting.
| Key Highlights: – Momentum weakens across 4H, 1D, and 1W charts as RSI and MACD trend lower – Resistance at 2.20–2.30 continues to reject upside attempts. – 2.00 remains the critical support level; losing it may trigger deeper downside. |
| Metric | Value |
|---|---|
| Coin Name | XRP |
| XRP Price | 2.095 – 2.096 USD |
| XRP Price Change 24h | ▼ –0.05% |
| XRP Price Change 7d | ▲ +1.86% |
| XRP Market Cap | 121,008,078,191 USD |
| Circulating Supply | 52,968,662,921 XRP |
XRP Price Snapshot
Market conditions show weakening momentum as XRP trades near structural support zones. The snapshot reflects a market entering a soft momentum phase as the indicators are cautious, even though the long-term structure remains intact.
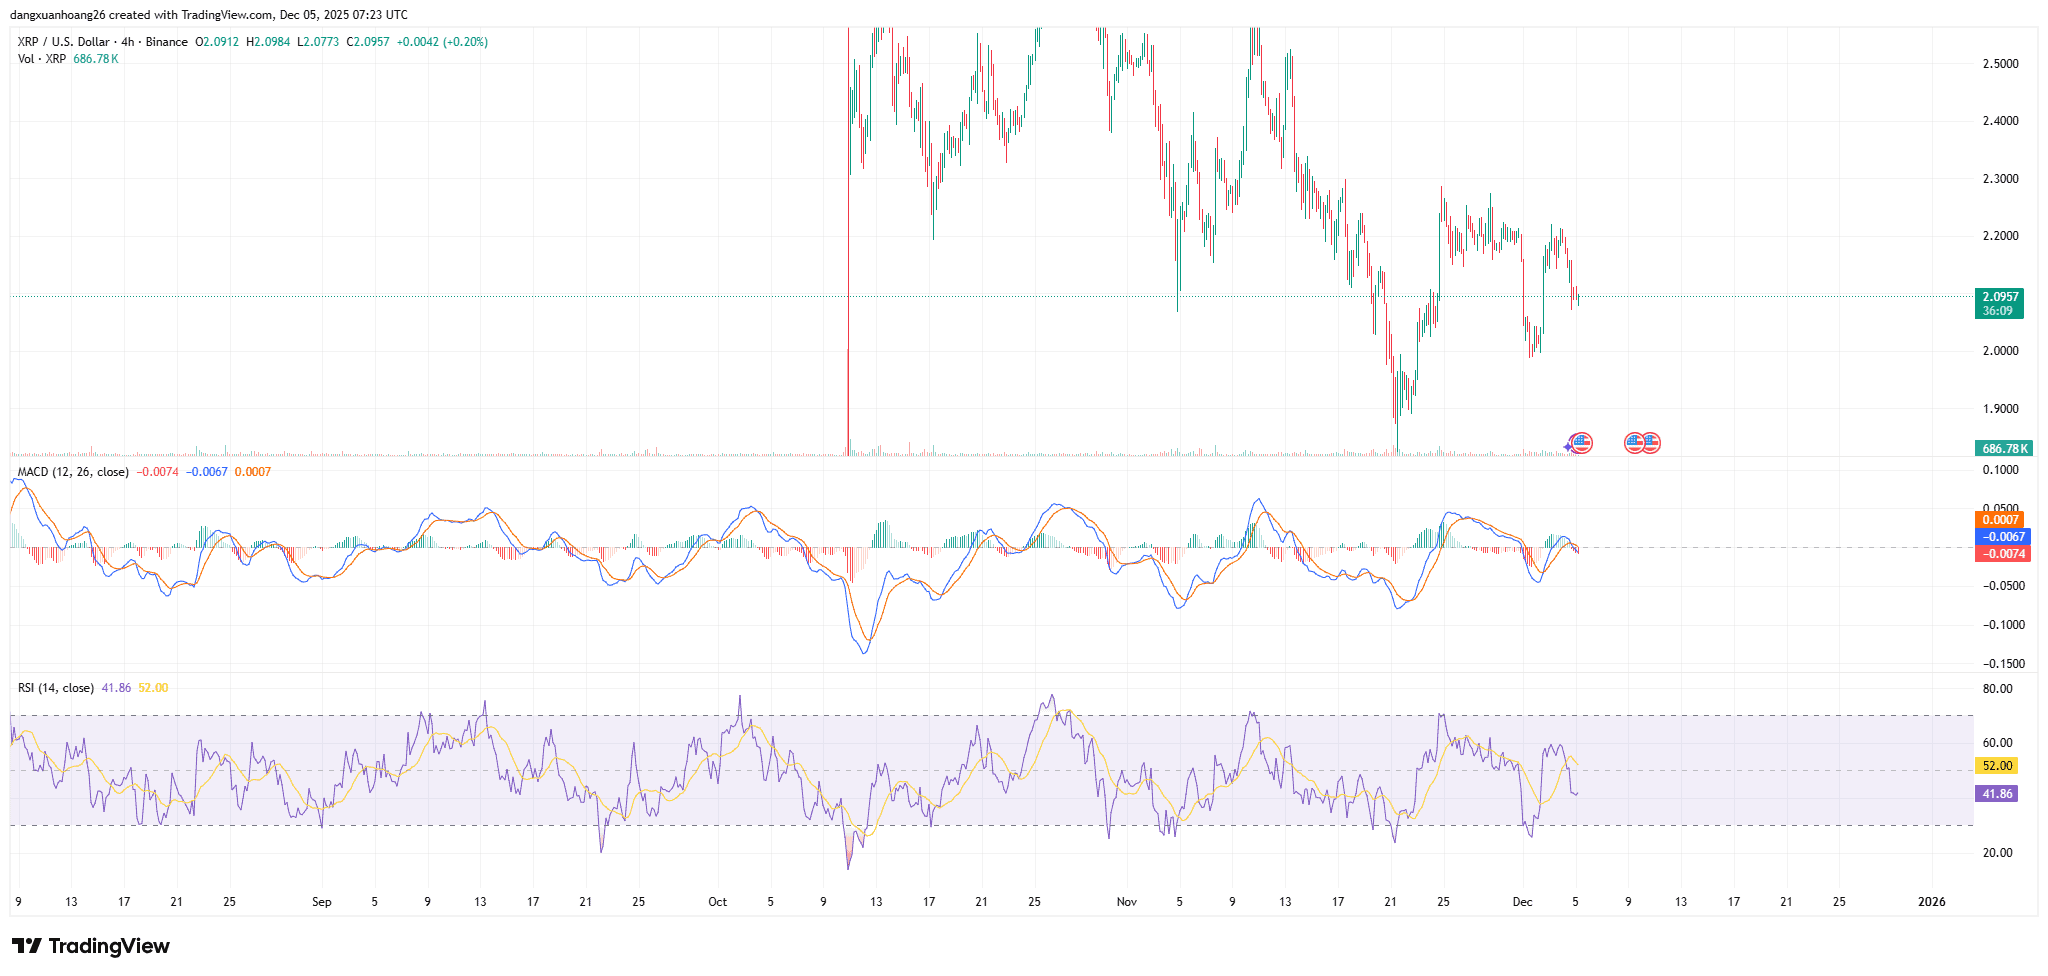
4H Chart Analysis: Sellers Still Dominate the Short Term Structure
XRP holds a bearish short-term structure as sellers maintain control and price struggles to reclaim intraday resistance near 2.12–2.15. The MACD prints red histogram bars, and the RSI, near 41, shows weakened short-term demand. Moving averages are still above price and confirm near-term downside pressure.
Daily Chart Outlook: Bearish Drift Continues as Trend Weakens
On the daily chart, XRP keeps within a sideways pattern while it has lost some momentum: MACD continues downwards with negative values, while RSI close to 43 sends signals that strength is not enough for further upside. A majority of mid-term moving averages point downwards, supporting the correction bias.
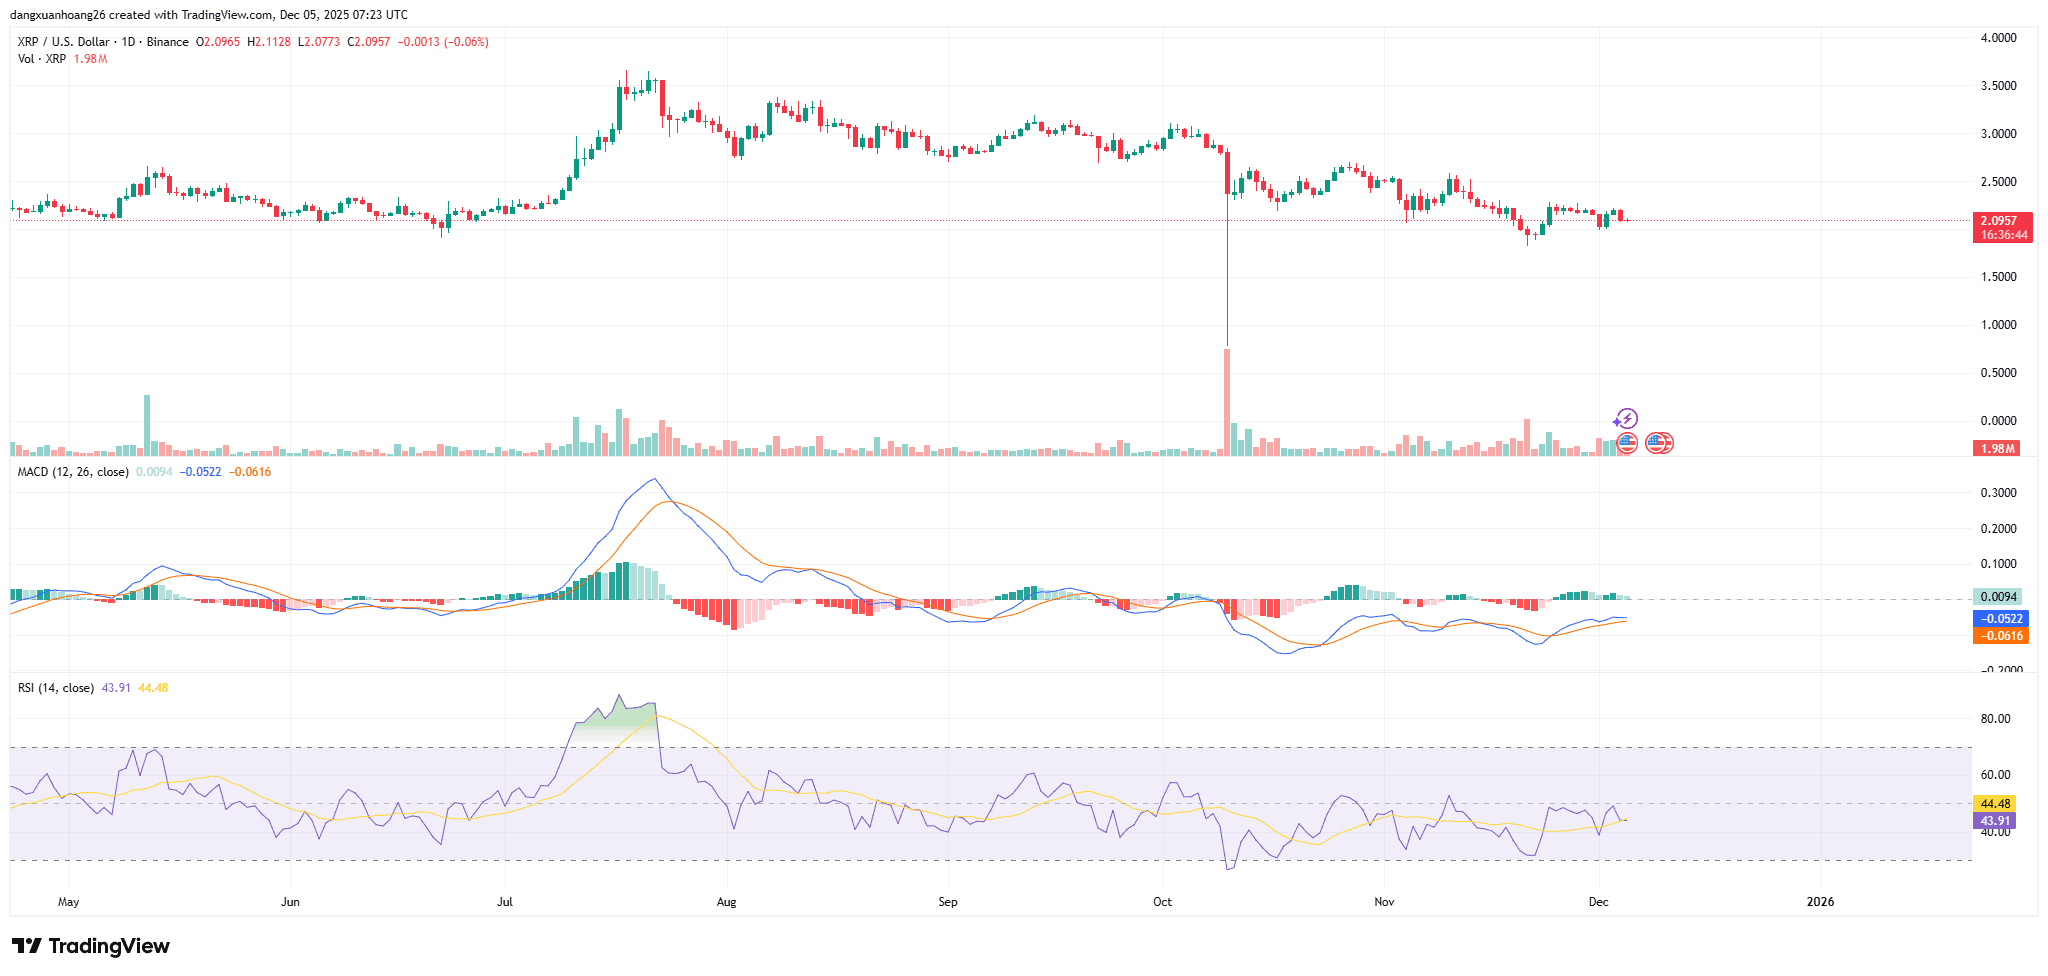
XRP requires a conclusive return above the 2.20 level for a legitimate breakout above its current lower high sequence. Until that point, the daily trend structure will remain fragile, accordingly exposed to further losses. Failure by buyers to defend 2.05 could awaken the lower range once more.
The short-term daily structure remains bearish as lower highs and lower lows continue to form. Also, RSI is reset and has room for a bounce; however, recovery does require a solid daily close back above 2.20 to break the lower-high pattern. In the absence of this, XRP can further consolidate in the range between 2.00 and 2.15 ahead of its direction.
Weekly Structure: Compression Signals Potential Breakout Setup
XRP shows a neutral yet weakening weekly structure as momentum softens and volatility compresses near support. The MACD slopes downward to show fading cycle momentum. RSI, holding around 41–48, keeps XRP in a neutral zone but far from strong bullish momentum.
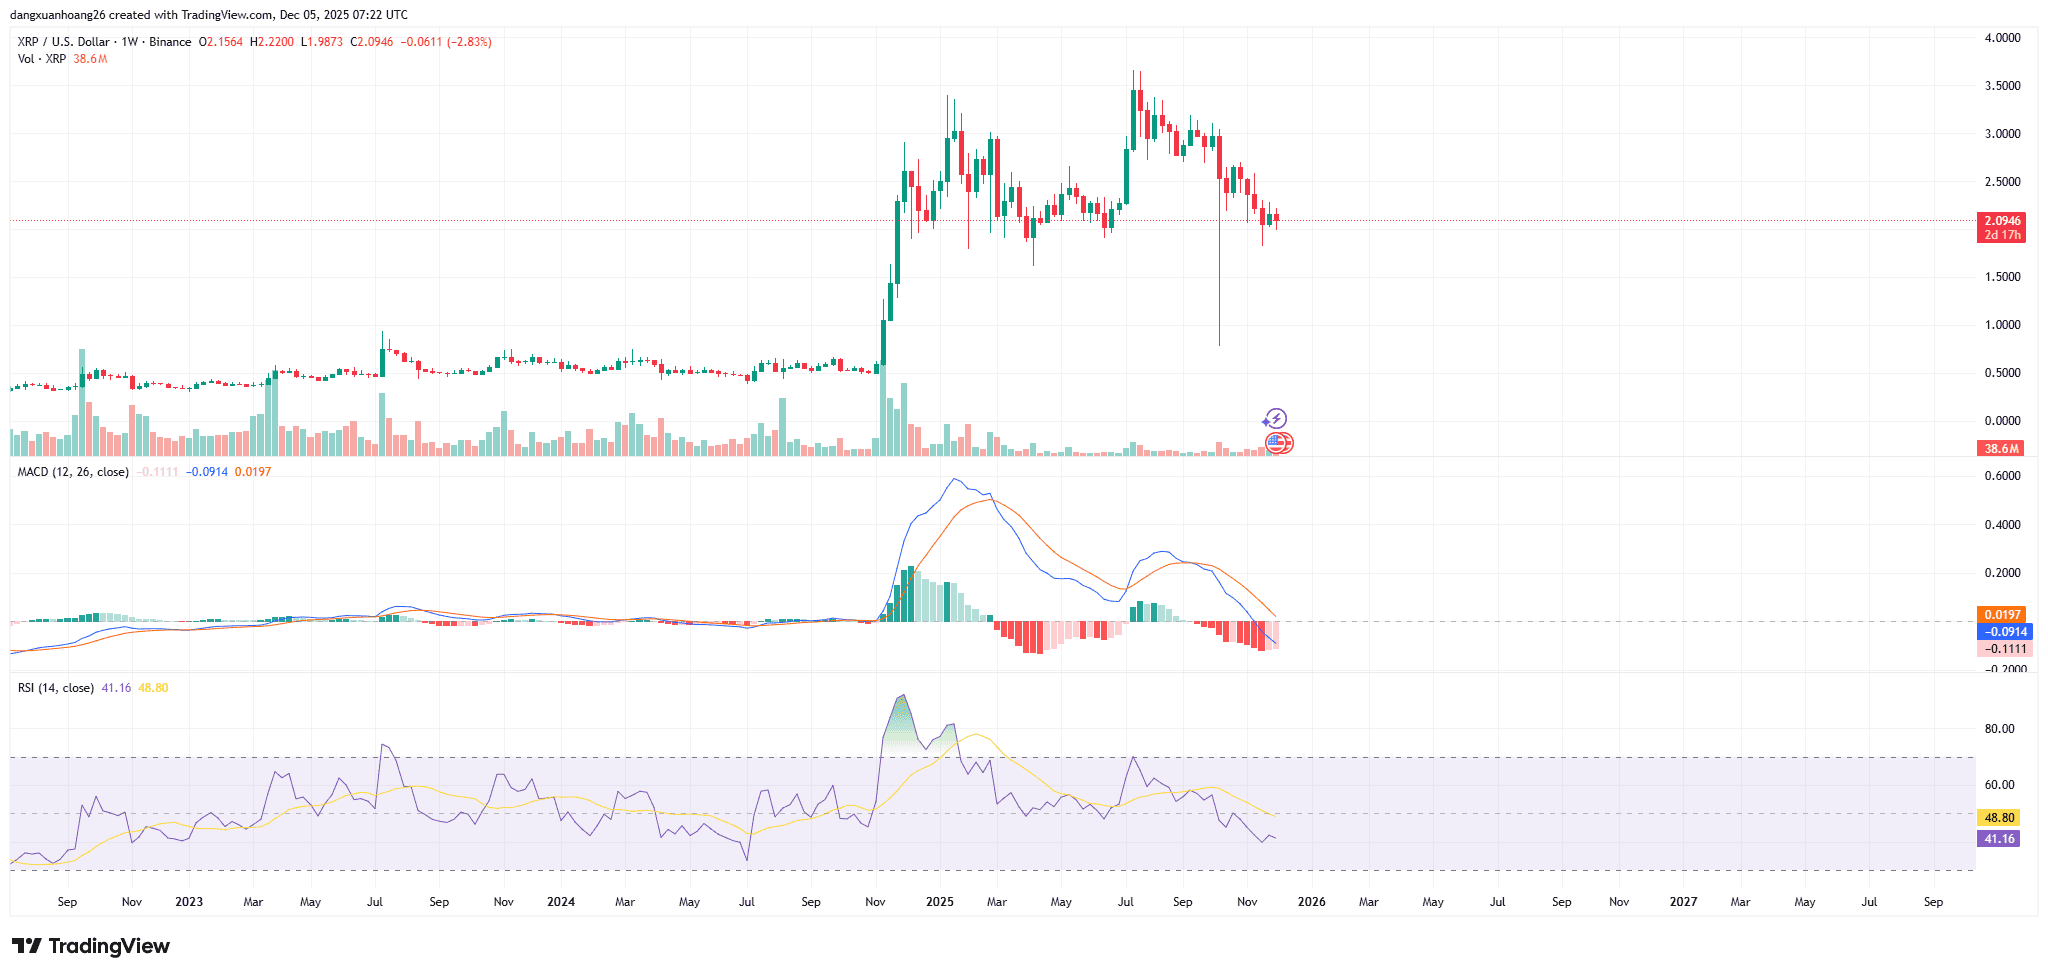
Weekly structure will be highly dependent on XRP’s response to the 2.00 macro support zone. The failure to hold this level could trigger a larger correction, while a successful defense may allow price to compress before a new trend leg. Resistance at 2.30 remains the weekly pivot.
Weekly price action signals growing indecision as liquidity declines and candle bodies contract near support. A close above 2.30 could trigger a broader extension toward 2.50+, while a close below 1.95 may open deeper downside levels.
Monthly Trend Analysis: Long Term Structure Remains Intact
The monthly timeframe remains the most constructive, maintaining a long-term sequence of higher lows since 2023. MACD is elevated but curving lower, signaling exhaustion after rallies. RSI >55 shows balance in the longer run but no longer hints at strong bullish vigor.
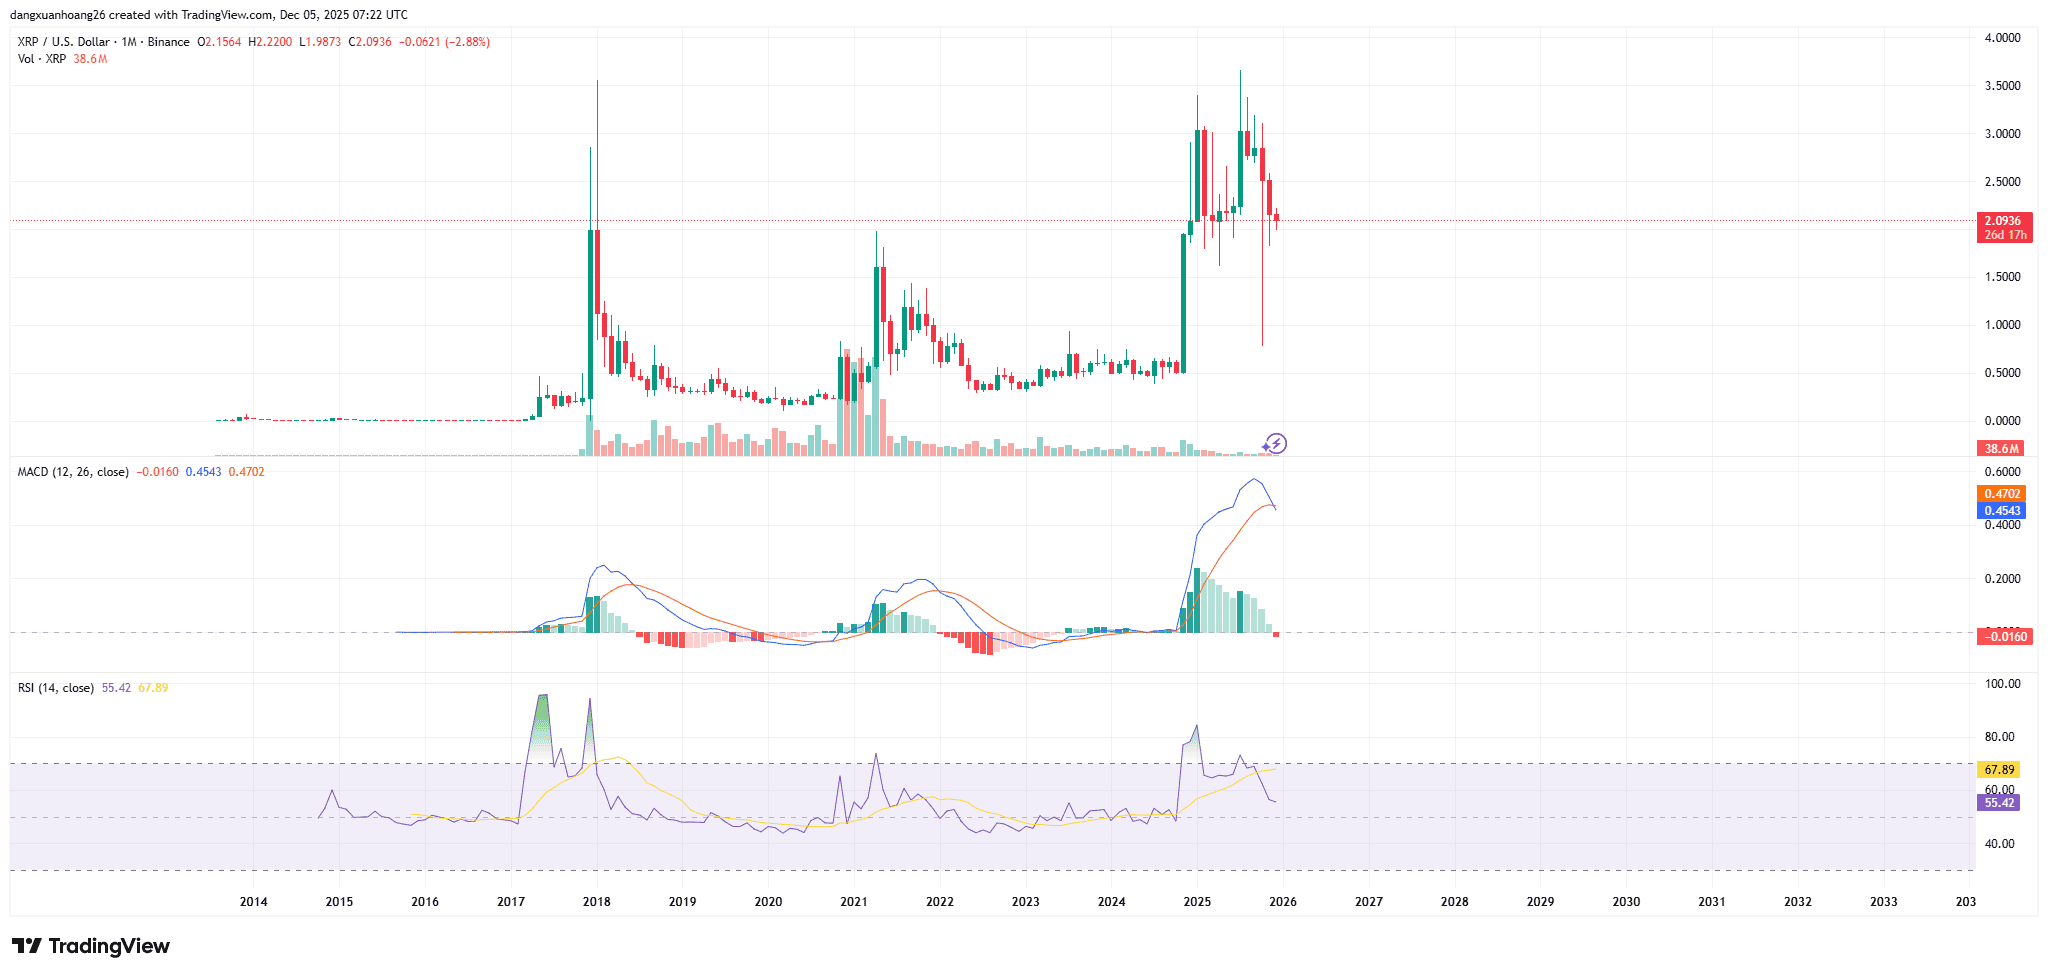
While short-term indicators are bearish, the long-term structure remains intact. As long as XRP holds above the 1.90–2.00 region, the macro bullish structure remains valid. A monthly regain of 2.30–2.40 would further strengthen long-term outlook.
Higher-timeframe accumulation behavior remains intact even as momentum slows. This suggests capital is not exiting the market but rather waiting for clearer conditions. If XRP can maintain support through the next few monthly candles, a new expansion phase may form in the following quarter.
| Disclaimer The information provided in this article is for educational and informational purposes only and does not constitute financial, investment, or legal advice. Cryptocurrency and blockchain markets are volatile, always do your own research (DYOR) before making any financial decisions. While TokenTopNews.com strives for accuracy and reliability, we do not guarantee the completeness or timeliness of any information provided. Some articles may include AI-assisted content, but all posts are reviewed and edited by human editors to ensure accuracy, transparency, and compliance with Google’s content quality standards. The opinions expressed are those of the author and do not necessarily reflect the views of TokenTopNews.com. TokenTopNews.com is not responsible for any financial losses resulting from reliance on information found on this site. |
Tracks AI-agent tokens, compute and data infrastructure, and where crypto markets are pricing AI-linked narratives.
Tracks ETF positioning, staking access, validator economics, and how Ethereum market structure evolves around institutional flows.