
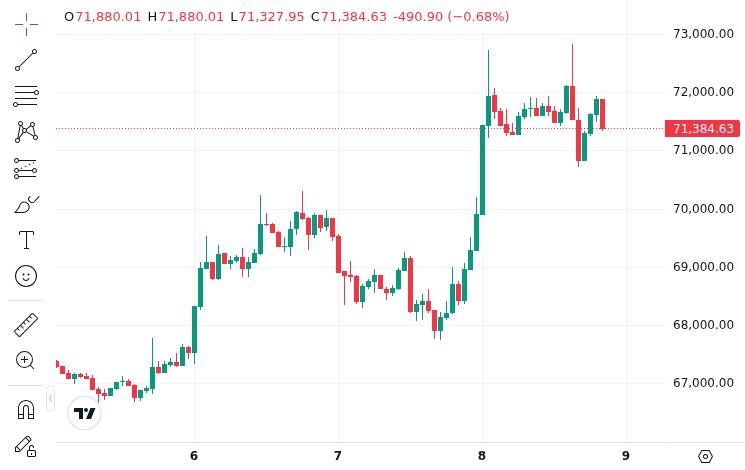
Bitcoin bounced from $67,000 to $72,000 during Week 14 of 2026, but on-chain data reveals the rally lacks conviction. Spot demand remains soft, futures participation has contracted, and the Fear and Greed Index sits deep in Extreme Fear territory, raising questions about whether this is a genuine recovery or just a bear market relief bounce.
Bitcoin’s $67K to $72K Rebound: What Drove the Move
Bitcoin climbed roughly 7.5% from its weekly low near $67,000 to trade at $71,535 at press time, with a 24-hour gain of 4.3%. Market capitalization stood at approximately $1.43 trillion on 24-hour trading volume of $55.1 billion.
Glassnode’s Week On-Chain 14 report, titled “Bouncing in a Bear,” characterized the environment as low-conviction despite the price rebound. The analytics firm placed the current trading range within a bear-market value zone between the Realized Price at $54,000 and the True Market Mean at $78,000.
The distinction matters: relief rallies driven by short covering or thin liquidity can produce sharp moves without signaling a macro trend change. With the Short-Term Holder Cost Basis sitting at $81,600, well above spot, recent buyers remain underwater, limiting the pool of participants willing to add risk.
The rebound echoes dynamics seen in previous cycles where institutional ETF flows briefly stabilized sentiment without resolving underlying demand weakness. US spot Bitcoin ETF 14-day average flows did flip back to modest net inflows after extended outflows, but the magnitude remains far from levels that would confirm a durable reversal.
Weak Spot Demand and Softer Futures: Why Conviction Is Still Limited
Spot volume quality tells the clearest story. Glassnode reported that Binance’s 30-day relative volume sits below the 1.0 baseline, indicating participation has not kept pace with the price recovery. When spot volume fails to confirm a move higher, the rally becomes vulnerable to unwinding.
Futures volume has also contracted, reinforcing the picture of declining engagement across derivatives markets. Bitcoin’s 30-day realized volatility registered at 42.5%, elevated enough to deter new positioning but not extreme enough to force capitulation. This creates a stalemate where neither bulls nor bears commit capital aggressively.
Leverage-driven bounces in thin markets can unwind rapidly when spot fails to follow through. Traders who recall how quickly past bear market rallies reversed will recognize the pattern: price moves up on positioning, not accumulation, and retraces once the short squeeze exhausts itself.
The Fear and Greed Index reading of 17, classified as Extreme Fear, underscores how disconnected sentiment remains from the price bounce. Markets do not typically sustain rallies when risk appetite is this suppressed.
What to Watch Next Week: Key Levels and Confirmation Signals
The $67,000 to $72,000 range now defines the immediate battleground. On the downside, a break below $67,000 would put the Realized Price at $54,000 into focus as the next major structural support. On the upside, reclaiming the True Market Mean at $78,000 would be the first credible signal of a regime shift.
Glassnode identified a long-gamma pocket between $69,000 and $71,500, where options market makers are positioned to dampen volatility. This creates a near-term range where price may consolidate, but it also means a break in either direction could accelerate once that gamma cushion is breached.
For bulls to gain confidence, three conditions need to materialize: spot volume rising above the 1.0 relative baseline on Binance, ETF net inflows sustaining above their current modest pace, and the Short-Term Holder Cost Basis at $81,600 coming within reach. Until those thresholds are met, the bounce remains a speculative positioning event rather than a trend reversal.
Bearish rejection signals include spot volume remaining below baseline during any push above $72,000, renewed ETF outflows, and funding rates turning sharply positive without corresponding spot demand, which would indicate the rally is leverage-driven and vulnerable to liquidation cascades.
The scenario framework for the coming week tilts cautiously bearish by probability. The data supports a range-bound consolidation between $69,000 and $73,000 as the base case, with a downside retest of $67,000 as the higher-probability tail event compared to a breakout above $75,000. Traders should monitor spot volume and ETF flow data daily rather than reacting to single-session price moves.
Disclaimer: This article is for informational purposes only and does not constitute financial or investment advice. Cryptocurrency and digital asset markets carry significant risk. Always do your own research before making decisions.
Tracks corporations, public companies, and funds using Bitcoin as a treasury reserve or strategic balance-sheet asset.
Tracks AI-agent tokens, compute and data infrastructure, and where crypto markets are pricing AI-linked narratives.