
Bitcoin treasury companies are the clearer fit for investors seeking purchased-Bitcoin exposure; miners are the better fit when the objective also includes production and infrastructure upside. The two models can both hold BTC, but they do not expose shareholders to the same business.
Strategy primarily acquires Bitcoin through capital markets, while MARA, Riot and CleanSpark produce Bitcoin through energy-intensive infrastructure. The correct comparison is not based on holdings alone. It examines the operating engine that creates BTC, the costs behind it, and the common-share claim after debt, dilution and fixed obligations. The three miner cases below are evaluated on those terms rather than treated as interchangeable treasury vehicles. The issuer pages for MARA, Riot Platforms and CleanSpark should control the dated production and balance-sheet fields.

Treasury companies and miners use different BTC engines
| Comparison point | Treasury company | Bitcoin miner |
|---|---|---|
| How BTC is acquired | Purchases funded by equity, debt or operating cash | Self-mining through power and computing infrastructure |
| Main operating variable | Capital-market access and financing cost | Hash rate, power price, fleet efficiency and network difficulty |
| BTC cost basis | Purchase price and transaction costs | Energy, hosting, depreciation and operating costs |
| Main dilution source | ATM stock, converts, warrants and acquisitions | Equity raises, expansion capex and acquisitions |
| Core risk | mNAV compression and refinancing | Mining margin compression and production volatility |
The Bitcoin treasury adoption framework explains why purchased BTC can be a capital-allocation strategy. MARA, Riot and CleanSpark are treated as the named miner cases inside this comparison rather than as a second competing URL.
Evidence needed for a fair comparison
Do not publish one winner from the BTC-held column. A miner can add BTC while margins deteriorate; Strategy can add BTC while its common-share denominator grows; and a company can retain more coins only because it deferred capex or operating spending.
- Strategy: Verify settled purchases, BTC per diluted share, mNAV, debt, preferred claims, cash and maturity runway.
- MARA: Verify BTC produced, BTC sold, BTC held, hash rate, uptime, energy cost, capex, debt and diluted shares.
- Riot: Verify production, sales, holdings, collateral, fleet efficiency, power strategy, facility capacity and dilution.
- CleanSpark: Verify production, retained BTC, BTC sold, cost per coin, hashrate, fleet efficiency, expansion capex and diluted shares.
- Acquisition route: Separate purchased BTC, mined BTC, retained production, pledged BTC and BTC used for liquidity.
Strategy: capital-market Bitcoin exposure
Strategy’s central economic mechanism is the conversion of capital-market access into Bitcoin holdings. Common stock, preferred securities and debt can fund purchases or corporate obligations. The company’s Bitcoin balance can grow without mining infrastructure, but the common-share outcome depends on the price paid for capital, the diluted denominator and claims senior to common equity.
That model has a different cost structure from mining. Strategy does not need to pay for a fleet of ASICs or a data-center power bill to produce each coin. It does, however, need to service debt, preferred distributions and operating costs while maintaining access to investors. The Bitcoin treasury market map tracks those claims separately from BTC units.
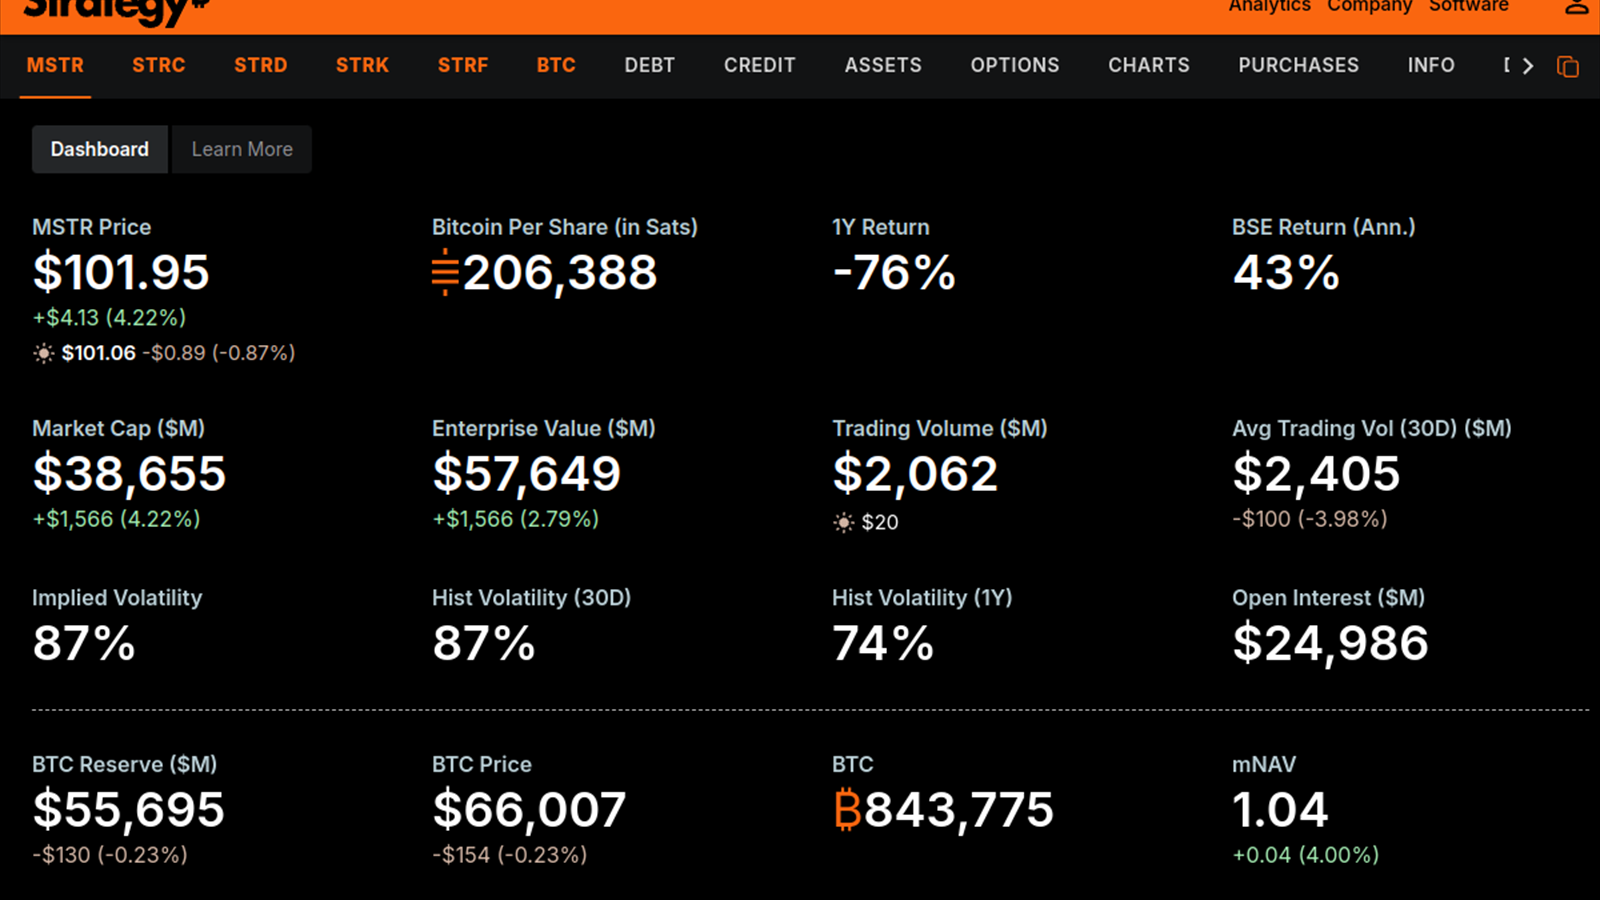
Strategy can also trade at a premium or discount to the value of its assets. That mNAV changes the economics of new issuance. When the stock trades at a premium, issuing equity may increase Bitcoin per share. When the premium compresses, the same action may become dilutive or unavailable. This is a capital-markets risk, not a mining-margin risk.
An investor discussion collected on August 27, 2026, about Strategy’s June 10, 2026 transactions focused on a reported 0.2-percentage-point decline in Bitcoin per share and whether a short-term dilution event should outweigh the longer trend. That reaction is sentiment, not proof of fair value, but it shows why the reader should reconcile each issuance with BTC per diluted share, the cash reserve and the capital raised rather than read the holdings total alone.
MARA: production scale and energy cost
MARA gives shareholders exposure to a large mining operation, Bitcoin production, energy arrangements, fleet investment and a retained-coin policy. Its BTC balance can grow through production rather than a purchase funded by a new security.
The key MARA fields are hash rate, energy cost, uptime, BTC produced, BTC sold, BTC held, debt, capex and diluted shares. A growing holdings number can result from production, a purchase, a merger or a change in treasury policy. The Bitcoin treasury market map should label the acquisition route instead of putting all BTC in one undifferentiated column.

MARA’s risk is operational leverage. If Bitcoin falls while network difficulty rises or energy costs increase, the margin on newly mined BTC can compress quickly. A treasury company may pause purchases; a miner still carries infrastructure and power obligations even when production economics deteriorate.
A March 2024 investor comparison of MARA and CleanSpark treated MARA’s scale and large BTC reserve as its main attraction, while also debating whether that scale justified the valuation. The discussion is an older investor view, not a current performance test; MARA should therefore be judged against the dated production, energy-cost and diluted-share fields above.
Riot: power strategy, infrastructure and collateral
Riot’s comparison starts with owned or controlled infrastructure, power strategy, expansion capacity and the cost of operating its fleet. The company’s Bitcoin treasury cannot be read independently from the physical system that produces it. A lower production cost can support retention, but power credits, curtailment revenue, capex and financing can affect the result as much as the BTC price.
For Riot, compare production and holdings against hash-rate growth rather than looking only at total BTC. A company can hold more Bitcoin because it retained more production, yet create less value if the fleet required disproportionate capital spending. Use a matched reporting period and identify whether cash flow came from mining, power arrangements, asset sales or financing.
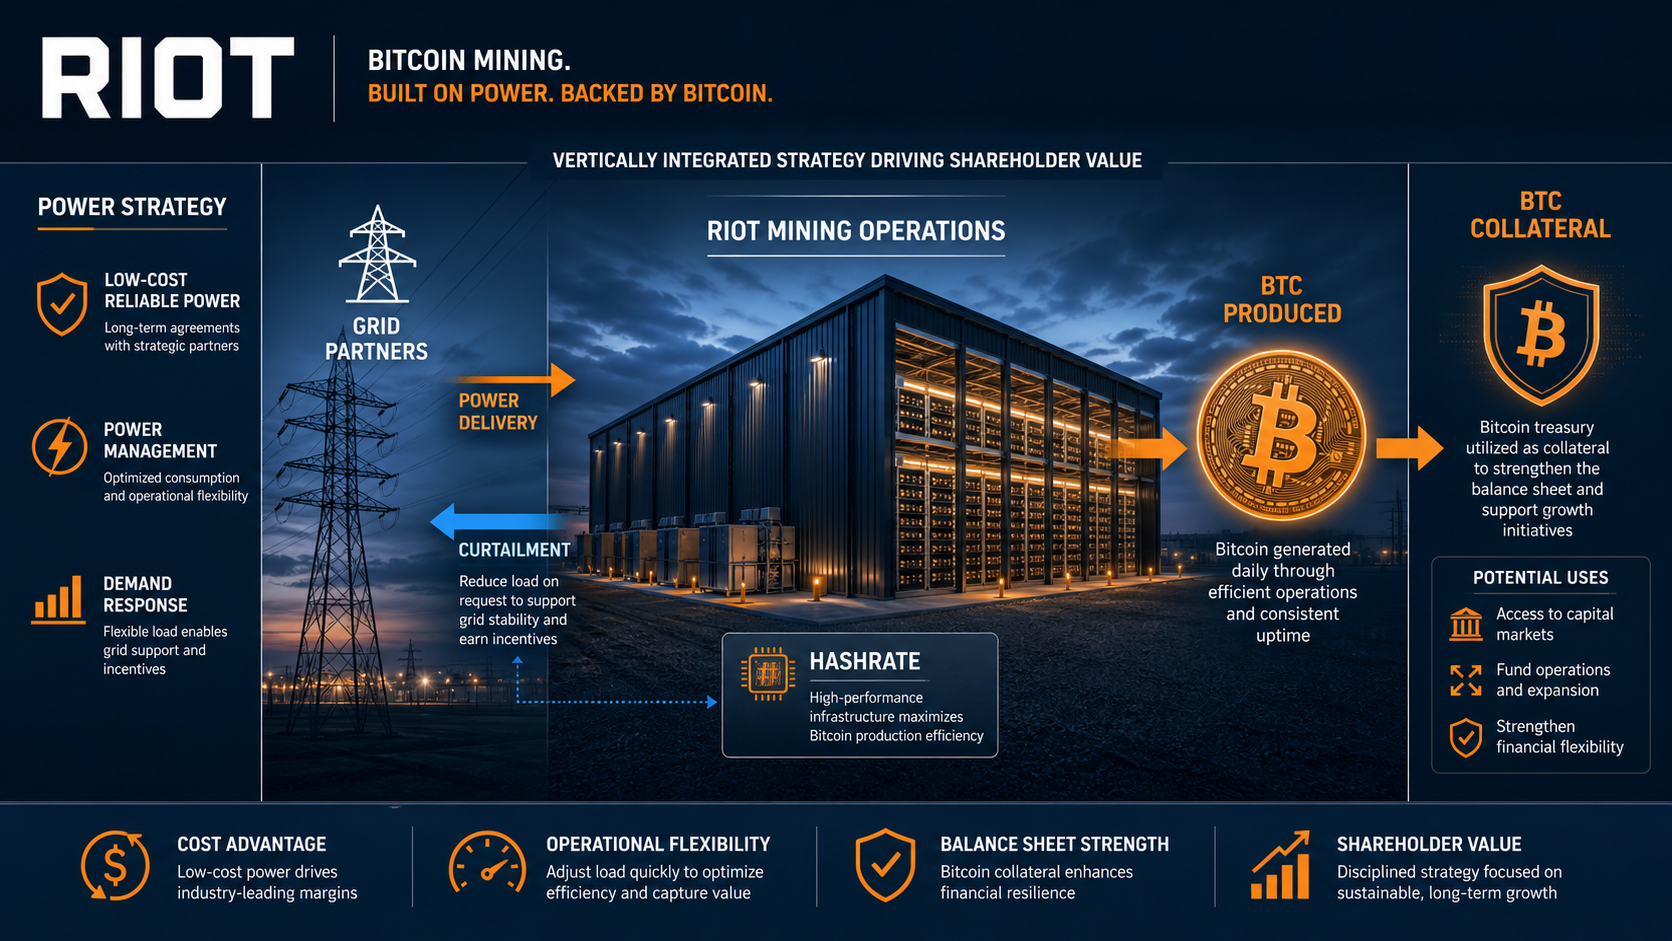
Riot also illustrates why miners and treasury companies should not share one “BTC per share” conclusion. BTC per share can be useful for both, but it does not capture the different costs required to create the BTC. In mining, future production depends on equipment, power and network conditions; in a treasury company, future accumulation depends more directly on financing access.
An April 2024 Riot investor discussion about production and expansion centered on delays in bringing planned capacity online and the gap between targeted and operating hashrate. That dated concern does not establish Riot’s current execution, but it identifies the practical check for readers: compare energized hashrate, production, capex milestones and facility capacity instead of relying on the announced expansion number.
CleanSpark: fleet efficiency and retained BTC
CleanSpark’s case study is centered on fleet efficiency, expansion, production and the balance between selling BTC for operating needs and retaining it as a treasury asset. The same BTC holding can represent a different economic thesis depending on whether it was purchased or mined and whether the company can fund growth without selling reserve assets.
The relevant comparison includes energy cost, hashrate, fleet age, BTC produced, BTC sold, BTC held, capex, debt and equity issuance. A lower cost of production can create a stronger margin, but it does not eliminate Bitcoin-price risk, facility risk or dilution. The company’s operating business remains the source of the reserve’s growth.
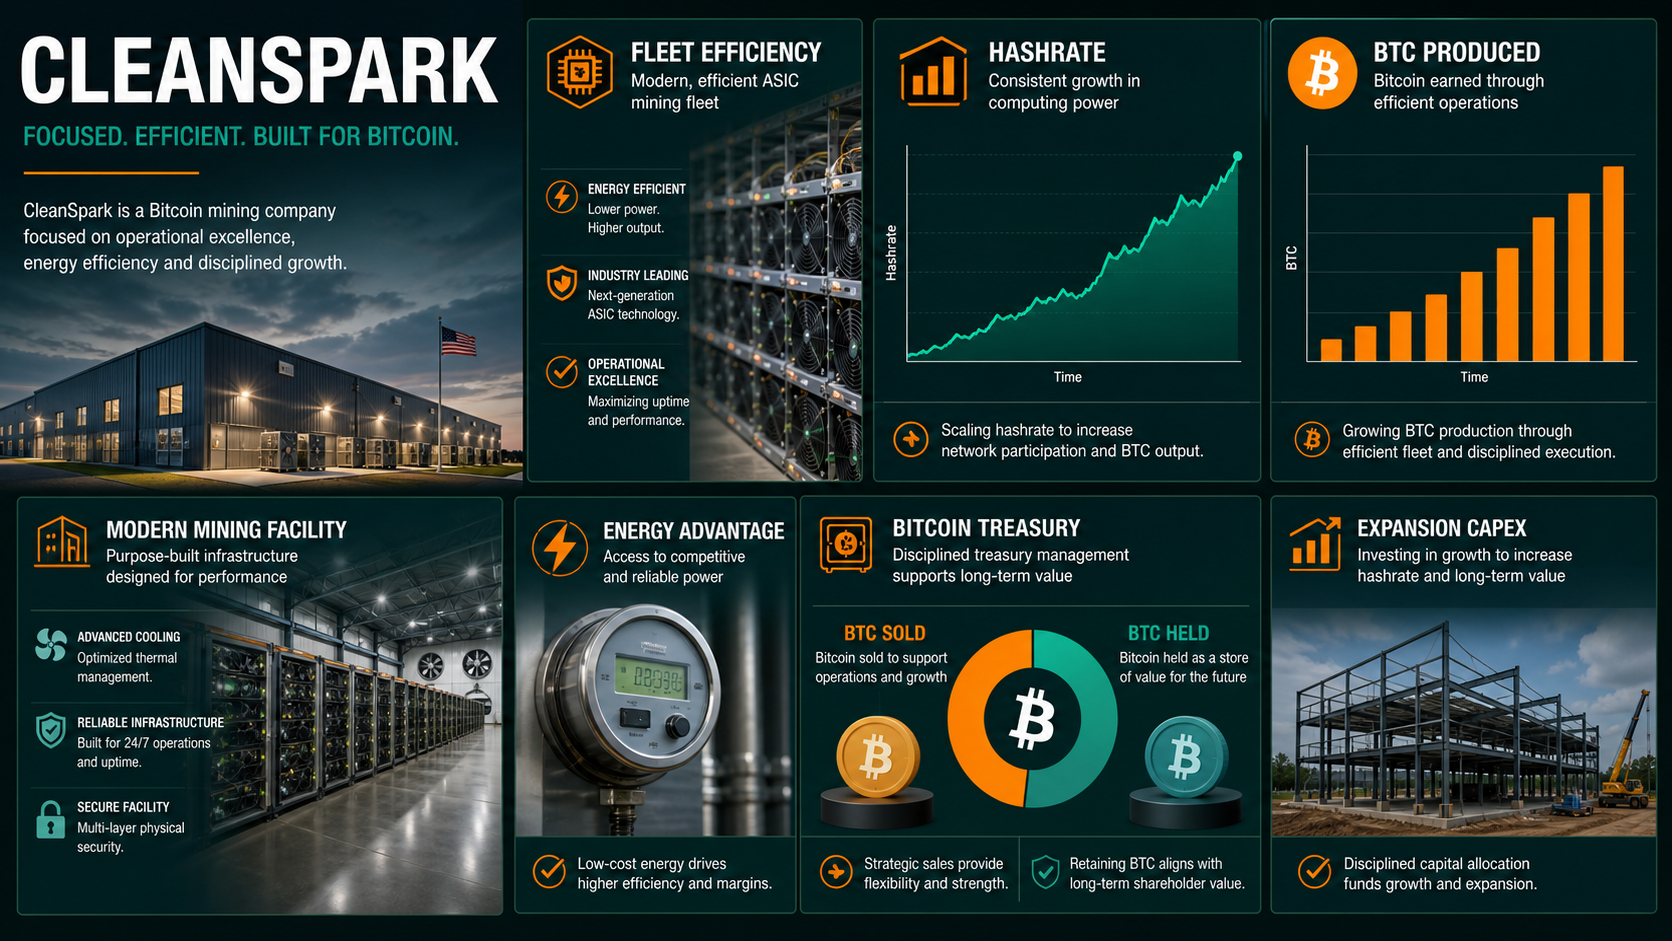
A March 2024 CleanSpark investor discussion described the appeal of a stronger balance sheet and rising hash power, then highlighted disappointment when share issuance increased the risk. That is one investor’s experience, not a verdict on the company; the useful implication is to read fleet growth beside dilution, BTC sold, capex and current BTC per diluted share.
Miner economics after the halving

The April 20, 2024 halving reduced the block subsidy from 6.25 BTC to 3.125 BTC per block. With fewer subsidy BTC available, a miner needs stronger fleet efficiency, lower power cost or a higher Bitcoin price to protect the margin on each coin produced.
- Hash price: Expected revenue per unit of hashrate, combining the block subsidy and transaction fees. Falling hash price can reduce revenue even when a miner’s own hashrate is unchanged.
- Transaction fees: Fees add to block revenue and can temporarily improve miner economics when network demand rises. They are variable, so they should not be treated as a recurring substitute for the subsidy.
- Curtailment revenue: A miner may reduce consumption during high-price power periods and receive demand-response or power-market revenue. This can lower net energy cost, but it is a power-management benefit rather than BTC production.
- Network difficulty: More competing hashrate raises the work required to earn the same BTC, so production growth does not automatically mean margin growth.
- Unit economics: Compare BTC price, hash price, energy cost, hosting, depreciation, capex and BTC sold together. A low energy cost alone does not prove that the common stock offers better Bitcoin exposure.
Cost basis versus production economics
Purchased-Bitcoin cost basis is usually tied to the transaction price and fees. Mining economics require a broader cost framework. Direct energy cost, hosting, depreciation, repairs, labor, corporate overhead and expansion capex can all affect the amount of cash required to produce and retain one BTC.
- Treasury company: Average cost usually means the purchase price and transaction fees for acquired BTC. The key follow-up is the cost of funding that purchase and the diluted denominator receiving the exposure.
- Miner: Cash cost can include energy and hosting, while all-in cost may also include depreciation, repairs, labor, overhead and expansion capex. The article must name the numerator, denominator, period and accounting scope.
- BTC per share: The ratio is useful for both models, but a miner’s future BTC depends on production economics while a treasury company’s future BTC depends more directly on financing access.
Dated operating, valuation and financing comparison
| Company | Operating period | BTC produced / source | BTC held | Share price / market cap snapshot | BTC NAV proxy and operating metric |
|---|---|---|---|---|---|
| MARA | Q2 2026 | 2,422 mined | 35,577 | $11.22 / $4.28B | $2.80B BTC NAV; 1.53x equity/BTC NAV; 70.3 EH/s and $38,690 purchased-energy cost per BTC |
| Riot | Q2 2026 | 1,587 mined | 11,380 | $20.61 / $7.17B | $0.90B BTC NAV; 7.99x equity/BTC NAV; $49,912 average mining cost and 5,821 BTC collateralized |
| CleanSpark | June 2026 | 614 mined | 13,924 | $12.18 / $2.78B | $1.10B BTC NAV; 2.53x equity/BTC NAV; 42.6 EH/s average hashrate and 179 BTC sold |
| Strategy | Dated holdings snapshot | Purchased, not mined | 843,775 | $123.19 / $43.43B | $66.52B BTC NAV; 0.65x equity/BTC NAV; financing access, BTC/share and senior claims |
This dated snapshot is a screen, not a single winner. MARA, Riot and CleanSpark depend on production economics; Strategy depends more directly on financing and the common-share denominator. BTC NAV uses BTC at $78,831 and equity prices and market caps observed on August 27, 2026. The equity/BTC NAV ratio is only a proxy because it excludes debt, cash, preferred claims and operating-business value.
- Treasury fields: settled purchases, BTC per diluted share, debt, preferred claims, cash and mNAV inputs.
- Miner fields: BTC produced, BTC sold, BTC held, EH/s, fleet efficiency, $/MWh, cash cost, curtailment revenue, debt, collateral and capex.
- Common fields: share price, market cap, diluted shares and BTC NAV, all refreshed from the same observation date.
Financing and dilution by model
Both models can issue equity, debt and preferred securities, but the proceeds serve different purposes. Treasury companies usually fund BTC purchases or refinance claims; miners fund machines, facilities, power, hosting, expansion capex, debt repayment or operations during weak margins.
- Treasury company issuance: Record the security issued, proceeds, fees, purchase amount, settlement date and change in BTC per diluted share. An issuance is not automatically accretive because the result depends on the price paid for capital and the denominator created.
- Miner financing: Match each raise to machines, facilities, power agreements, hosting and expansion capex. Then compare the funding with production, cash cost, curtailment revenue, BTC sold and BTC pledged as collateral.
- Capital-stack check: Calculate fully diluted shares and place debt, preferred claims, purchase commitments, power contracts, hosting obligations and maturities ahead of common equity. The treasury financing and risk context provides the capital-stack framework; miners also require an infrastructure and liquidity check.
- Shareholder outcome: Test whether the financing increases BTC per diluted share or productive capacity after fees, interest, preferred dividends and operating commitments. More BTC on the balance sheet is not enough if the new claims grow faster than the exposure.
Conclusion
Treasury companies are the clearer choice for purchased-Bitcoin exposure because the main variables are financing access, BTC per diluted share, mNAV and senior claims. Miners are the better fit when the thesis includes hashrate, power economics, transaction fees, curtailment revenue and operating leverage. Neither is a pure BTC proxy: one adds a capital stack, while the other adds an industrial production business.
Compare market cap and BTC NAV only as a first screen, then add debt, cash, preferred claims, diluted shares, mining costs and capex before treating any premium or discount as meaningful. The result should reward the intended exposure, whether that is accumulation speed, production efficiency, financing optionality or balance-sheet resilience.
Frequently asked questions
Is a Bitcoin miner a Bitcoin treasury company?
Not automatically. A miner may hold Bitcoin, but its core economics can remain production, power, equipment and network difficulty. Classification depends on materiality, stated policy, acquisition route and reporting.
Does a miner’s BTC per share mean the same thing as a treasury company’s BTC per share?
The ratio has the same basic denominator, but the growth engine differs. A miner’s future BTC depends on production and costs; a treasury company’s future BTC depends more directly on purchases and financing.
Which is more sensitive to energy prices?
Miners. Energy, hosting and facility economics directly affect production margins. Treasury companies can have operating costs, but their Bitcoin acquisition does not require a mining fleet.
Can miners use Bitcoin as collateral?
Yes, depending on their financing arrangements. The filing must identify pledged units, lender rights, maturity and cure terms before the risk can be assessed.
Disclaimer: This article is for informational purposes only and does not constitute financial or investment advice. Cryptocurrency and digital asset markets carry significant risk. Always do your own research before making decisions.
Tracks corporations, public companies, and funds using Bitcoin as a treasury reserve or strategic balance-sheet asset.
Tracks ETF positioning, staking access, validator economics, and how Ethereum market structure evolves around institutional flows.


