Bitcoin Bear Markets in Q4 2025 and Q1 2026 Echo 2022
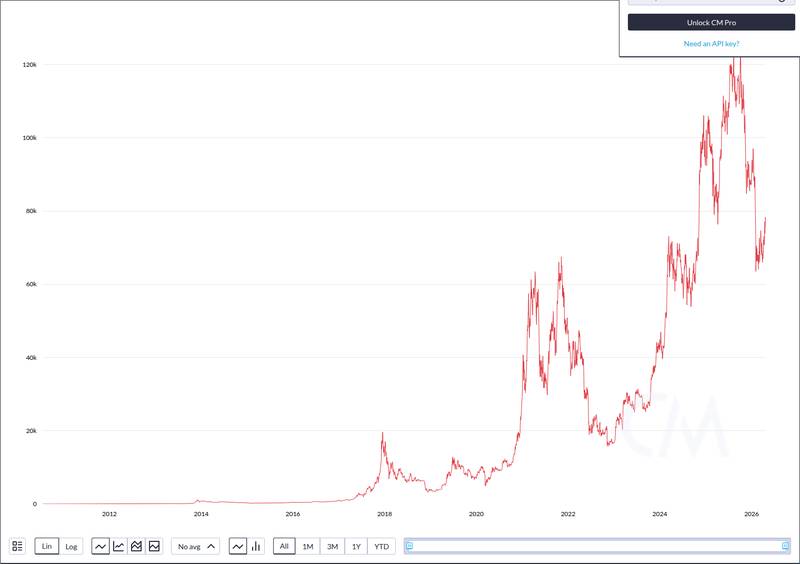
Bitcoin BTC +0.00% has now endured two consecutive bear markets spanning Q4 2025 and Q1 2026, a sequence that bears structural resemblance to the tightening-driven collapse of 2022. With BTC trading roughly 30% below its all-time high of $126,000, the prolonged stress period is testing investor conviction in ways the market has not seen in over three years.
Why Q4 2025 and Q1 2026 Read as One Extended Bear Phase
Rather than treating the Q4 2025 and Q1 2026 drawdowns as separate corrections, the pattern reads more clearly as a single extended bearish stretch. Bitcoin traded approximately 30% below the $126,000 all-time high amid what has been described as back-to-back quarterly bear markets.
The distinction matters because isolated pullbacks typically resolve within weeks, while consecutive quarterly declines suggest deeper structural pressure. When Q4 bleeds directly into Q1 without a meaningful recovery, sentiment compounds downward and forced selling accelerates.
This framing aligns with broader crypto market conditions. The CoinGecko Q1 2026 crypto industry report documented the quarter’s challenging environment, reinforcing that Bitcoin’s weakness was part of a wider market contraction.
Viewing the two quarters as one continuous stress test sharpens the comparison to prior cycles, particularly 2022, when Bitcoin also endured multiple quarters of sustained decline rather than a single sharp crash.
How the 2025-2026 Slide Mirrors the 2022 Tightening Collapse
The 2022 Bitcoin bear market was defined by aggressive monetary tightening. The Federal Reserve’s rapid rate hikes drained liquidity from risk assets, and Bitcoin fell from its November 2021 peak of roughly $69,000 to below $16,000 over the course of several quarters.
The Q4 2025 to Q1 2026 sequence echoes that pattern in structure if not in catalyst. Both episodes featured sustained multi-quarter declines rather than a single capitulation event, and both saw Bitcoin tested at levels that forced long-term holders to reassess conviction. Recent signs of repositioning, including dormant whale movements reactivating after extended inactivity, suggest that even patient holders began adjusting exposure.
One key similarity is the erosion of market structure over time. In 2022, each successive quarter brought lower highs and lower lows, grinding down sentiment until capitulation arrived. The Q4 2025 into Q1 2026 decline has followed a comparable stair-step lower pattern, with relief rallies failing to reclaim prior levels.
However, the comparison has limits. The 2022 collapse was compounded by cascading counterparty failures, from Terra/Luna to FTX, that amplified losses far beyond what monetary policy alone would have caused. The current drawdown has not, so far, featured equivalent systemic blowups.
The macro backdrop also differs. In 2022, tightening was accelerating into a market that had never priced it in. In 2025-2026, markets entered the decline with years of tightening already absorbed, which may limit the depth of the comparison even if the surface pattern looks similar.
What This 2022-Style Setup Could Signal Next
If the 2022 parallel holds, the next phase to watch is whether Bitcoin finds a durable bottom or continues the stair-step lower pattern into Q2 2026. In 2022, the final capitulation came in November with the FTX collapse, months after many assumed the worst was over.
The indicators that would confirm a break from the 2022 script include a sustained reclaim of key price levels above the current range, stabilization in broader risk appetite, and the absence of forced selling from leveraged participants. Upcoming events like the Bitcoin Conference in Las Vegas could serve as sentiment checkpoints for institutional positioning.
For those tracking on-chain flows, exchange reserve trends and large wallet movements offer real-time signals about whether accumulation or distribution is dominating. Recent significant token withdrawals from centralized exchanges hint at a shift toward self-custody, a pattern that preceded recoveries in past cycles.
The 2022 bear market ultimately lasted roughly a year before a sustained recovery began. If the current cycle rhymes rather than repeats, the duration of the Q4 2025 to Q1 2026 decline, not just its depth, will determine whether this comparison holds or breaks down entirely.
Disclaimer: This article is for informational purposes only and does not constitute financial or investment advice. Cryptocurrency and digital asset markets carry significant risk. Always do your own research before making decisions.